You're about to create your best presentation ever

Six Sigma Presentation Template

Create your presentation by reusing one of our great community templates.

six sigma

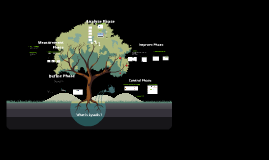
Transcript: mfg control strategy A program aimed at the elimination of defects from every product, process and transaction. reduced variation improve predictability specially where precison matters In metric terms : 3.4 defects per million opportunities. Six Sigma processes are executed by Six Sigma Green Belts and Six Sigma Black Belts, and are overseen by Six Sigma Master Black Belts. used to develop new processes or products at Six Sigma quality levels green belts- Trained individuals who work on projects in their job. A GB is likely to spend at least 20% of their time on Six sigma projects. black belts- Six sigma experts who work on projects across the business. They serve as full time Change Agents. Master Black belts- Quality leaders responsible for strategy, training, mentoring and deployment of six sigma. They must know everything the BBs know. Japanese firm took over a Motorola factory manufacturing TV sets in USA. Under Japanese management the factory was producing TV sets with 1/12th the number of defects they had produced under Motorola management In early 1980s, the company responded to the competitive pressure by engaging in a publicity campaign decrying “unfair” competition MOTOROLA took 8 long years to get to Six sigma from about 3 sigma levels. They provided one million hours of training per year to their employees on Six Sigma. In 1986, the company spent $44 million as training alone ,which represented 2.4% of the company pay roll. MOTOROLA return on investment during ‘87- ’94 : reduced in-process defect levels by a factor of 200 , reduced manufacturing costs by $14 billions, increased employee production by 126% and increased stock holders share value fourfold Today, Motorola is known worldwide as a quality leader They attribute their key success to “ Six Sigma Quality” They wasted $7 million trying to train bottom up. Recognizing their mistake, they set up “Motorola University” Company spends $110 million per year Motorola’s most significant contribution was to change the discussion of quality from one where quality levels were measured in percentages (parts per hundred) to a discussion of parts per million. Motorola spent more than $25 million on an initial top-down training programme 70,000 workers has participated It saved $250 million on failure costs just after one year of implementation Increased productivity an average of 12.3 % per year Reduced the cost of poor quality by more than 84% Eliminated 99.7% of in-process defects Saved more than $11 billion in manufacturing costs Realized an average annual compounded growth rate of 17% in revenues, earnings and stock price Six-sigma : A quantitative confusion improve- identify improvement breakthroughs,identify high gain alternatives, select preferred approach, design the future state, determine the new Sigma level, perform cost/benefit analysis, design dashboards/ scorecards, and create a preliminary implementation plan. others- Solution alternatives Experiments with solution alternatives Planning for future change measure- overall performance of the Core Business Process is measured a- Data Collection Plan and Data Collection b- Data evaluation c- Failure Mode and Effects Analysis 4 Analyze Phase- a-Source Analysis b- Process Analysis c-Data Analysis d- Resource Analysis e-Communication analysis six sigma 2 defects per billion opportunities or 3.4 defects per million opportunities 1 Define- a-Project team is Formed b-Document customers Core Business process c-Develop a project charter d-Develop the SIPOC process map this concept has various step to improve the quality of output Control - ensure that the processes continue to work well, produce desired output results, and maintain quality levels. You will be concerned with four specific aspects of control, which are: Quality control Standardization Control methods and alternatives Responding when defects occur 3 5 presented by:- Manoj Kumar Gupta Roll no.-5 Batch-B 2

Six Sigma Presentation

Transcript: Questionnaire Explanation of our study (boundaries) - Perceived time - Expected time Errors types: - Not filling the entire questionnaire - Misunderstood the question Measure Explanation of our study (boundaries) Errors types: - confusion with the stopwatch - skipping the starting / ending 3 types of data: -Measured time - Perceived time - Expected time 2.Process control system 2. Implementation in the shop A new environment Solution Selection Matrix Graphics 1.Measurement system and process capability Questionnaire and Chronometer Sellers can feel threatened Point of measure Defect definition General explanation of our study : - In Lysadis Shop - 3 times - 2 per team: 1 for the measure, 1 for the questionnaire Satisfy the clients Offer new selling opportunity Anticipate futures demand Project Scope: All customers Project Boundaries: Starts when the customer enters in the store... ....ends when the employee starts talking to the customers Improvement steps Analyse Phase 2. Specification limits Define Phase WHY ? Customers wait longer A poor visibility of the customer’s location - Wrong orientation of the shelves -A mistake in the signage. 3. Validation of measurement system What is Lysadis ? Designing the physical shop structure Managing the staff Fishbone Diagram The shop's opening CTQ: The customers’ waiting time Business case: Improving the “customer welcoming” process FMEA 3.Closing the DMAIC Poor visibility of the customers by the sellers Stock problems Customer is lost The employee cannot see the customer The customer needs help The next customer’s waiting time The shelves are high and the department’s orientation are inappropriate: The bad management of the supplies It is hardly detectable Happens frequently : no IT gouvernance The severity is medium Ranking the best solutions Control Phase 1. Root causes Improve Phase The employees’ tasks - Inefficient management. -lack or a bad communication 1. Project « Y » Identification Measurement Phase CTQ : «Waiting time for the customer» Measured Time / Expected Time Optimizing the ergonomics The new shop's construction

Six-Sigma

Transcript: OVERVIEW 3. Inventories Originality Importance of Six-Sigma History A Word from Jack Welch Importance of Six-Sigma What is Six-Sigma Six-Sigma Ratings Lean Six-Sigma 7 Types of Waste Criticisms Questions 1. Defects Baird, C. W. (2009). Lean six-sigma. Six Sigma Manual for Small & Medium Businesses, 221-224. doi: 9781601382337 Dalgleish, S. (2003). Six sigma? no thanks. Quality, 42(4), 22. doi: 03609936 Goh, T. N. (2011). Six sigma in industry: Some observations after twenty-five years. Quality & Reliability Engineering International, 27(2), 221-227. doi: 10.1002/qre.1093 Jiju, A. (2008). Pros and cons of six sigma: An academic perspective. Retrieved from http://web.archive.org/web/20080723015058/http:/www.onesixsigma.com/node/7630 Pande, P. S., & Holpp, L. (2002). What is six sigma?. (ebook ed., pp. 1-96). McGraw-Hill. Thurston, L. D. (2006). What is six sigma and where is it going?. Caribbean Business, 34(44), 42-43. doi: 01948326 Costly Lean Six-Sigma THE END Defects Conclusion Six-Sigma Ratings Reducing Cycle Time 4. Unnecessary Processing Lean Manufacturing + Six Sigma = Lean Six-Sigma References History Certifications What is Six-Sigma? Six-Sigma 7. Waiting 7 Types of Waste Black Belt 2. Overproduction 5. Unnecessary Movement of People Six-Sigma Members By Michael Arias Champion History A Word From Jack Welch Importance of Six Sigma What is Six-Sigma? Six-Sigma Ratings Lean Six-Sigma 7 Types of Waste Criticisms Customer Satisfaction Reducing Defects Criticisms Green Belt Quality Improvement Initiative Quality Data Master Black Belt (MBB) 6. Unnecessary Transport of Goods

Six Sigma

Transcript: The main advantage of Six Sigma compared to other approaches to quality control is that Six Sigma is customer driven. Six Sigma is defined as a limit of 3.4 defects per one million products or service processes, where anything not acceptable to the end customer is considered a defect. Six Sigma addresses the entire process behind the production of an item or completion of a service, rather than just the final outcome. It is proactive rather than reactive, as it sets out to determine how improvements can be made even before defects or shortcomings are found DMADV Define, Measure, Analyse, Improve and Control Used to improve an existing business process “A quality-control program developed in 1986 by Motorola. Initially, it emphasized cycle-time improvement and reducing manufacturing defects” “Since then, Six Sigma has evolved into a more general business-management philosophy focused on meeting customer requirements, improving customer retention, and improving and sustaining business products and services.” It is a TQM technique It creates a system for improving quality gradually Source: Investopedia - http://www.investopedia.com/terms/s/six-sigma.asp Basic steps of six sigma Disadvantages DMAIC Advantages Six Sigma Because Six Sigma is applied to all aspects of the production and planning process, it may create rigidity and bureaucracy that can create delays and stifle creativity. In addition, its customer focus may be taken to extremes, where internal quality-control measures that make sense for a company are not taken because of the overlying goal of achieving the Six Sigma-stipulated level of consumer satisfaction. For example, an inexpensive measure that carries a risk of a slightly higher defect rate may be rejected in favor of a more expensive measure that helps to achieve Six Sigma, but adversely affects profitability. To achieve Six Sigma, a process must not produce more than 3.4 defects per million opportunities. A Six Sigma opportunity is then the total quantity of chances for a defect. Implemented by Green Belts, Black Belts and Master Black Belts. Data intensive approach that relies solely upon facts. Accomplished through the use of two sub-methodologies; DMAIC and DMADV. Definition Define, Measure, Analyse, Design and Verify Used to create new product or process designs

Six Sigma Presentation

Transcript: Six Sigma "How to Adult" Class Class Layout Layout of the class Location and frequency Method of presentation Interactive/fun element with prize Credit Card (How To Use, How To Apply, Credit Score, Paying Off Debt) Student Loans (How To Create, How To Budget, Money Allocation) Personal Budgeting (Savings Vs Checkings) Investing and Saving for the Future (Different Interest Rate Types, Benefits Of Compound Interest, Retirement, 401K, Pensions) Insurance (FAQs, Life, Renters, Disability) Topics Topic Frequency/Location Location/frequency Once a month every month, each month is a new topic Location will be Skype, people can join from anywhere, link to meeting will be sent to email. Presenter will have video on to make the presentation more engaging Logistics Presenting Logistics One topic per class, each topic will have sub topics. At the end of each sub topic, there will be questions. Participants earn points for answering the questions quickly and correctly. At the end of the class, there will be a short game and the person with the most points from the questions + game will win a small prize Interactive Interactive element 2 questions per sub topic, Kahoot format; the faster the participants give the correct answer, the more points they get. At the end there will be a slightly bigger game (maybe mini Jeopardy or something). At the end, the person with the most points will be getting a small prize (you can send Visa gift cards through email, $10 minimum, as an example) Where we stand Reaching out to the community Wins Wins Initiatives Initiatives Top performers Top performers New business New business Current standings Current standings 43,4% Q3 vs Q4 10,2% YoY Quarterly Sales Summary Quarterly Sales Summary 15% 37% 9% 2% Losses Losses Failed initiatives Failed initiatives Lost businesses Lost businesses Missed Opportunities Missed Opportunities Takeaways Takeaways Closing the gap Leveraging technology Proposal Proposal Initiative 1 Initiative 1 Initiative 2 Initiative 2 Initiative 3 Initiative 3 Risks Risks Risk 1 Risk 1 Risk 2 Risk 2 Risk 3 Risk 3 Risk management Risk management Benefits Benefits Benefit 1 Benefit 1 Benefit 2 Benefit 2 Benefit 3 Benefit 3 The forecast The forecast The sales funnel The sales funnel Projections Projections What does Guardian gain from this? Impact on Guardian Name Recognition: Name Recognition This will allow us to flaunt our amazing company culture to the outside world. When people think of Guardian as a result of this program, they will think of a philanthropic company that helps out local communities. Future Potential Employees Resources The program will spark an interest for a Guardian career in all the students that are reached by the program. Many students don't know about the different opportunities that exist at Guardian, and this will increase awareness. Employees would love to volunteer to teach high school students Employee Relations

Now you can make any subject more engaging and memorable