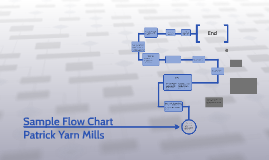
Sample Test Flow Chart
Transcript: If p-value <= alpha (default is .01) reject H0 If normal: t.test(column1, column2, alternative= "two.sided", paired=TRUE) *test mu=median z1=c(3.9,1.4,4.1,5.5,2.3) z2=c(5.4,2.0,4.8,3.8,3.5) z3=c(1.3,.7,2.2,NaN, NaN) shapiro.test(z1) shapiro.test(z2) shapiro.test(z3) Z=c(z1,z2,z3) f=c("Treatment 1", "Treatment 2", "Treatment 3") k=3 n=5 tm=gl(k, 1, n*k, factor(f)) tm av=aov(Z~ tm) summary(av) Z-test t.test(x,y, alternative="two.sided", mu=, var.equal=TRUE) Step 1: z-test (n>30) z.test( ) t-test (n<=30) t.test( ) v>.05, pooled Two Sample (Not Normal) r-code: wilcox.test(x,y, alternative=,mu=) p-value > 0.05 ~ normal (fail to reject H0) p-value<= 0.05 ~ not normal (reject H0) If both are normal and n>30, then If: If all p-values> 0.05 z.test(x,y, alternative="two.sided", mu=, sigma.x=,sigma.y=, conf.level=.95) v=var.test(x,y) One Sample If p-value <= alpha (default is .01) reject H0 *two.sided, greater, less than If: at least one column is not normal, use Wilcox test there is correlation between two columns AND both are normal, then use paired t-test at least one column has n<30 and both are normal, then use 2 sample t-test both of the columns has n>30, then use z-test. r-code: kruskal.test(data not normal) ✳✱* Check both columns for normality Two Sample (Normal) *Install Teaching Demos Package, library(BSDA), library(mass) If v<.05, unpooled Sample Test Flow Chart *sigma.x= sd(x) sigma.y= sd(y) Test the Median *dnn=data not normal dn= data normal shapiro.test( ) If at least one shapiro.test: p-value <=0.05 Step 0: Check normality If p-value >alpha, fail to reject H0 If p-value > alpha (default is .01) reject H0 t.test(x,y, alternative="two.sided", mu=) Normal Distribution If p-value > alpha (default is .01) fail to reject H0 T-test Paired T-Test If not normal, sign.test(dnn-dn) Not Normal Three or more samples sign.test(data set, md=0, alternative= "two.sided", conf.level= 0.95 ) If p-value <=alpha, reject H0 shapiro.test(x) shapiro.test(y) shapiro.test(z)


