Flow Chart Project
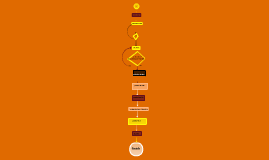
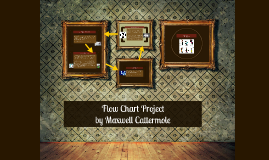
Transcript: Investigation/observations: Asking questions about the data, interpretation of findings. Does the data answer hypothesis or infer an incorrect prediction? Inspiration to form new testable questions can be found from your findings. Challenging existing procedures advances Science. Conclusion/outcome: simply....... Communication/feedback: Analyze results, support or challenge a hypothesis, form new testable questions with different variables. Testing Ideas/theories: Flow Chart Project by Maxwell Cattermole New data can answer curiosity, build knowledge, solve problems, inform people, and address issues but most importantly it can raise new questions. It is through new scientific discoveries that the world around us advances. Gathering Data: First you make a question. Then you make your hypothesis (testable idea), predictions, then you gather your materials, all of which should be noted. (So if you have to change something, like a measurement) you can tell which material to use. All stages of the experiment have to be accurately observed and recorded so it can either be repeated if successful or changed if necessary. For instance in an experiment to test drive a car think of all the variables! For example tire wear, driving line, hp, power to weight ratio, amount of fuel, type of fuel, driver experience, size of car and engine size. Interpreting data/analysis This is one of the most important parts of science, this is where you share all of your data, research, evidence and see if it is well received, maybe even publish it if it is good enough. Use feedback to change/advance your experiment. News breaking scientific discovery is usually published in magazines, for example Nature; New Scientist and Science, rather than books. This is because science is constantly changing and by the time books are published, the discovery might be outdated. Scientific journals such as Nature are published weekly.


