You're about to create your best presentation ever

Powerpoint Workflow Diagram Template

Create your presentation by reusing a template from our community or transition your PowerPoint deck into a visually compelling Prezi presentation.

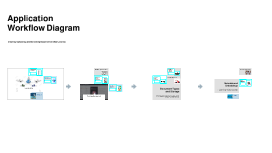
Application Workflow Diagram

Transcript: Photos Reusable assets Application Workflow Diagram Ante molestie mattis arcu gravida viverra adipiscing volutpat. Ultrices eget viverra eu lectus ullamcorper. Consequat dictum tristique lectus augue felis nascetur amet non. Velit sit placerat tincidunt integer amet massa justo risus netus. Ornare sagittis malesuada varius cursus ipsum erat libero metus eget. Colors Assets Creating, Uploading, and Generating Documents in User Libraries 04 01 02 03 Title Aa Aa Subtitle S M W T T S F Paragraph Aa Aa Metadata Storage in Database Storage of User Information User Library Creation Text File Upload Process Metadata is crucial for managing user and library information, ensuring efficient retrieval and organization. This information includes document titles, authors, upload dates, and types, which are all stored in the SQLLITE database, allowing for fast access and updates. User information, including preferences and authentication data, is securely stored within the SQLLITE database. This structured storage enables swift user access and enhances the security of sensitive information, allowing for efficient user management throughout the application. The user initiates the process by creating a library, defining a unique structure for organizing subjects and topics. This facilitates a personalized and systematic approach to managing educational resources, making it easier for users to store and retrieve documents efficiently. Text files created by users are similarly stored in the STORAGE. Metadata relevant to the text files is recorded in the database, enabling easy access and organization. Like PDFs, these files also benefit from vector embeddings stored in ChromaDB for powerful contextual analysis and retrieval. PDF Upload Process YouTube Video Utilization Storage of Library Information Document Upload Process Vector Embeddings using OpenAI Users can upload PDF documents which are stored in the STORAGE. The application captures essential metadata to facilitate document management and retrieval. Additionally, vector embeddings created using OpenAI are generated and stored in ChromaDB to enhance search functionalities and improve user interaction. The library information, encompassing subjects and topics, is systematically organized and stored in the SQLLITE database. This enables seamless retrieval and management of content for users, ensuring the library structure is easily navigable and efficiently maintained. Users can utilize YouTube videos within the application by invoking a video summarizer. The video transcript is stored in the STORAGE while relevant metadata is logged in the database. This allows users to access summarized content efficiently, with vector embeddings stored in ChromaDB to augment search capabilities. Users can upload three types of documents: PDFs, text files, and YouTube videos. Each document type goes through a specific upload process that ensures metadata is captured and properly stored in the database for easy access and future reference. Vector embeddings convert documents into numerical representations, enabling machines to process textual data more intelligently. OpenAI's models extract relevant features from documents, enhancing search capabilities and enabling document similarity assessments. Metadata and Embeddings SQLLITE Database Overview User Workflow The SQLLITE database serves as a lightweight, serverless solution for storing structured data related to users and libraries. Its compact size and ease of use make it ideal for applications with limited infrastructure requirements, ensuring quick access and efficient data handling. Understanding how metadata and vector embeddings enhance document management through structured storage and intelligent analysis is vital for application efficiency. The user workflow for creating a library includes essential functions like library creation, document uploads, and generating tests from uploaded documents. This process is streamlined for ease of use, allowing users to effectively manage their resources and learning materials. Document Types and Storage Generating Tests from Documents ChromaDB Integration Database Management This section covers the three primary document types that users can upload and how each is processed, stored, and utilized within the application workflow. Each document type requires specific handling to ensure metadata and vector embeddings are effectively captured and stored. ChromaDB plays a key role in managing vector embeddings, providing a specialized storage solution optimized for retrieval tasks. This integration allows seamless comparisons and searches across document embeddings, enhancing the efficiency of document management systems. Once documents are uploaded, users can generate tests based on the content. This feature not only evaluates understanding but also enhances engagement and learning retention by transforming static documents into dynamic assessments. This section delves into the foundational

Workflow Diagram Representation

Transcript: Photos Reusable assets Workflow Diagram Representation Ante molestie mattis arcu gravida viverra adipiscing volutpat. Ultrices eget viverra eu lectus ullamcorper. Consequat dictum tristique lectus augue felis nascetur amet non. Velit sit placerat tincidunt integer amet massa justo risus netus. Ornare sagittis malesuada varius cursus ipsum erat libero metus eget. Colors Assets Visualizing Workflow States in Green 04 01 02 03 Title Aa Aa Subtitle S M W T T S F Paragraph Aa Aa Assigning Colors to States Importance of Visual Representation Future Trends in Workflow Visualization Overview of State Management Best Practices for Color Application Benefits of Colored Workflow Diagrams State management refers to tracking the various statuses of tasks within a workflow. It is critical for measuring progress, ensuring accountability, and maintaining smooth transitions between different stages of a project. Maintain consistency across all workflow diagrams by adhering to a predefined color palette. Limit the use of colors to avoid confusion and use shades to indicate variations in state urgency or importance. Color Coding in Workflow Diagrams Visual representation of workflows enhances comprehension, making it easier to identify bottlenecks and redundancies. Effective diagrams can lead to improved teamwork and communication, resulting in more efficient project execution. The future of workflow visualization will likely incorporate advanced technologies such as AI to provide real-time updates and predictive analytics. Increased interactivity and customization options will enhance user engagement and understanding. Colors should be assigned based on the significance and status of each state in the workflow. A common approach is using green for completed tasks, yellow for in-progress, and red for issues, enhancing user comprehension. Using color coding in workflow diagrams improves clarity, enhances understanding, and aids in quick identification of states and transitions. Green, in particular, signals completion and indicates efficient progress in processes. Purpose of Color Coding Summary of Key Points Color coding plays a significant role in workflow diagrams by enhancing clarity, communication, and quicker identification of workflow states. It effectively categorizes processes and improves user engagement with visual elements. Definition of Workflow Diagrams Identifying Workflow States Color coding enhances understanding by providing immediate visual cues that categorize different aspects of a workflow. It simplifies complex processes and enables stakeholders to quickly grasp the status of various tasks, thereby improving overall efficiency. Workflow diagrams effectively portray processes, making complex systems understandable. Key points include the importance of visual representation, the role of color coding, and best practices in associating states. Workflow diagrams depict the flow of tasks and decisions within a project or process. They can incorporate various elements such as inputs, outputs, tasks, and decisions, providing clarity and structure to otherwise complex processes. Begin by mapping out all critical steps in your workflow. Each step represents a unique state that should be clearly defined and understood by all stakeholders to ensure effective communication and execution. Implementing State Colors Conclusion and Future Directions Significance of Using Green Green is often associated with growth, stability, and action. In workflow diagrams, using green to indicate completed tasks or healthy processes reinforces a sense of progress and success, enhancing motivation among teams. Psychological Impact of Colors Introduction to Workflow Diagrams This section encapsulates the significance of colored workflow diagrams in streamlining processes and attention management. Effective visualization techniques can significantly enhance the clarity and efficiency of workflow communication. Effectively coloring workflow states enhances clarity and visual appeal, making processes easier to understand. This section outlines how to identify and assign colors to workflow states while adhering to best practices for application. Colors invoke emotions and reactions, influencing decision-making. Research shows that blue promotes calm and focus, while red can signal urgency. Understanding these impacts is essential for effective color selection in workflow diagrams. Workflow diagrams are essential tools that visually represent a sequence of processes or tasks. They simplify complex workflows, making it easier to analyze, optimize, and communicate workflows across various stakeholders. 01 02 03 04 Adding final touches... Last checks... Add some details here Add some details here Polishing up... Adding final touches... This is where your presentation starts. Provide context for your audience and make it easy for them to follow. Keep your words short and punchy so your audience stays focused. You can add imagery and frames to

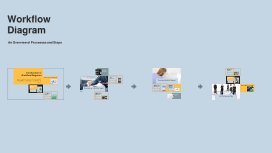
Workflow Diagram

Transcript: Photos Reusable assets Workflow Diagram Ante molestie mattis arcu gravida viverra adipiscing volutpat. Ultrices eget viverra eu lectus ullamcorper. Consequat dictum tristique lectus augue felis nascetur amet non. Velit sit placerat tincidunt integer amet massa justo risus netus. Ornare sagittis malesuada varius cursus ipsum erat libero metus eget. Colors Assets An Overview of Processes and Steps 04 01 02 03 Title Aa Aa Subtitle S M W T T S F Paragraph Aa Aa Ensuring Clarity Connecting Lines and Arrows Clarity in presentations is vital. Use consistent terminology, clearly defined symbols, and logical flow to ensure that all stakeholders can easily follow the process without confusion or misunderstanding. Connecting lines and arrows visualize how different components of a workflow are related. They provide clarity on the relationships between tasks, ensuring that the flow of information or actions is easily understandable for all stakeholders involved. Introduction to Workflow Diagrams Definition of Workflow Diagrams Flow Direction Keeping it Simple Creating a Workflow Diagram Workflow diagrams provide a visual representation of processes, illustrating the sequence of tasks, decision points, and flow of information. Understanding these diagrams is essential for improving efficiency and communication in any organization. Flow direction indicates the sequence of steps in a process, usually represented with arrows that guide users through the workflow. Understanding flow direction helps in identifying dependencies and enhances the comprehension of the overall process structure. Simplicity maximizes understanding. Overcomplicated diagrams confuse users and dilute the message. Use clear symbols, minimize text, and focus on key steps to ensure your audience grasps the workflow quickly and accurately. Workflow diagrams are graphical representations that illustrate a series of tasks or steps in a process. They provide a clear structure and help identify relationships between different activities, ensuring everyone understands the overall workflow. A well-structured workflow diagram articulates processes in a clear and visual format, facilitating understanding and efficiency. Understanding how to identify processes and map steps is vital for effective diagram creation. Regular Updates and Revisions Identifying the Process Tools for Diagram Creation Applications in Various Industries Components of a Workflow Diagram Processes evolve, so should your diagrams. Regular updates ensure that workflow diagrams remain relevant and accurate, reflecting the current procedures and enhancing operational efficiency. Begin by defining the specific process to be diagrammed, detailing its purpose and goals. Engage stakeholders to gather accurate, detailed information about each component and its role in the workflow. Select appropriate software tools to create workflow diagrams, such as Microsoft Visio, Lucidchart, or online platforms like Miro. These tools offer templates and features that facilitate quick diagram development and customization. Understanding the key components of a workflow diagram is essential for creating effective visual representations of processes. This section focuses on nodes, flow direction, and connecting lines that form the backbone of any workflow diagram. Workflow diagrams are utilized across diverse sectors, including healthcare for patient management, manufacturing for production lines, and software development for task management. Their versatility makes them integral to operational excellence. Importance of Workflow Diagrams Nodes and Symbols Mapping the Steps Best Practices and Tips Chart each step in the process sequentially, ensuring logical flow and connection. Utilize symbols and lines to represent actions, decisions, and pathways enabling clear communication of the workflow's structure. Workflow diagrams enhance clarity by simplifying complex processes. They facilitate communication among team members and help identify bottlenecks, ensuring smoother operations and better resource management. Nodes represent different stages or activities in a workflow diagram, using specific shapes to convey meaning. Common symbols include ovals for start/end points, rectangles for tasks, and diamonds for decision points, ensuring standardization in diagram representation. Effective workflow diagrams significantly enhance process understanding. Implementing best practices such as simplicity, clarity, and maintenance leads to better communication and productivity in team settings.

Now you can make any subject more engaging and memorable