You're about to create your best presentation ever

Poster Presentation Bibliography Template

Create your presentation by reusing one of our great community templates.

Bibliography Presentation

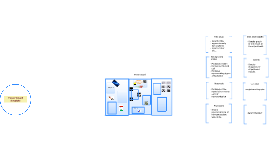
Transcript: m 1 2 p b Y g X Abby Dreher and Marisa Ishikawa Music Dictionaries and Encyclopedias Music Dictionaries and Encyclopedias Purpose: "to provide accurate factual information and authoritative summaries of topics" Purpose: "to provide accurate factual information and authoritative summaries of topics" Examples? Dictionaries = Encyclopedias Currency is Important Dates of works cited Publish date How was the work published? Online Currency is Important How to Use: How to Use: Beginning stages of research Understand the dictionary’s purpose, audiences, and level of detail Look for special dictionaries Do not be afraid of foreign language dictionaries Consult more than one Online vs. Print Online vs. Print Pros 24/7 access Text search Frequently updated Readability Audio examples Online Online Cons Some resources are user generated Inability to browse No preserved history Print Print Pros Historical document Changing perspectives Performance practice Bias National pride Cons Currency Inconvenient Evaluation Checklist Evaluation Checklist Are articles/entries signed? Are bibliographies/discographies included? Are the authors experts? How many authors? Are they international? Who edited the work? Print or online? New research or previous edition? Does the work have a history with multiple editions? What is the scope? What information is included in work lists? Are cross-references and index present? Resource Types Resource Types http://www.colorado.edu/libraries/libraries/howard-b-waltz-music-library Online Online Comprehensive Print Print Foreign Language Specific geographical places Special Biographical Musical Terms Musical Instruments Opera and Musical Theater Performance Practice Jazz, Rock, Popular Music Miscellaneous Citation Formula - Encyclopedia Article Citation Formula - Encyclopedia Article Print Article Author Last, First. “Article Title.” In Encyclopedia Title, edited by First Last. Place: Publisher, date. Ex: Daverio, John and Eric Sams. “Schumann, Robert.” In New Grove Dictionary of Music and Musicians, 2nd ed., edited by Stanley Sadie. New York: Grove, 2011 Online Article Author Last, First. “Article Title.” In Encyclopedia Title, edited by First Last. Place: Publisher, date. Ex: Daverio, John and Eric Sams. “Schumann, Robert.” In Grove Music Online. Oxford University Press, 2001-. Accessed November 27, 2011. http://www.oxfordmusiconlinecom/subscriber/article/grove/music/40704. Article Author First Last, "Article Title," in Encyclopedia Title, ed. First Last (Place: Publisher, date), volume number: page number(s). Citation Forumla - Footnote/Endnote Print Article Author First Last, "Article Title," in Encyclopedia Title, Publisher, date published/modified, accessed date, URL or DOI. Online John Daverio and Eric Sams, "Schumann, Robert," in New Grove Dictionary of Music and Musicians, 2nd ed., ed. Stanley Sadie (New York: Grove, 2001), 22:765. John Daverio and Eric Sams, "Schumann, Robert," in Grove Music Online (Oxford University Press, 2001-), accessed November 27, 2011, http://www.oxfordmusiconline.com/subscriber/article/grove/music/40704

Mini-Poster Template

Transcript: Survivorship Curve Before and After Influenza Vaccine Cady Houghton Procedure Background Experimental Design Methods Research Question 1) A data base of cemeteries was looked up to find death dates and information. 2) From the data base information was put into a google drive document. 3) 40 people dying before the 1945 influenza vaccine were put into one chart showing the ages of death. 4) 40 people dying after the 1945 influenza vaccine were put into another chart also showing ages of death. 5) Both charts of groups of people were converted into a life history table. 6) From each life history table the data was put into another chart to make two survivorship curve charts. 7) The survivorship curve charts were put into one survivorship curve chart to show the difference in curves. A laptop was used for this lab. If the influenza vaccine works then if we compare the survivorship curve of before and after the vaccine it will show people living longer because the vaccine will be decreasing the death rate. The independent variable in this experiment is the influenza vaccine. The dependent variable is the death rate in this experiment. The exponential variables in this experiment are the other disease epidemics during the time period the data was chosen from. The control is the survivorship curve before the influenza vaccine and the experimental is the survivorship curve after the influenza vaccine. The survivorship curves of before and after the influenza vaccine was created are both Type I survivorship curves. They also have the caracteristics for K-selected species. While they are both Type I and K-selected species, the survivorship curve after the influenza vaccine was created had a decrease in death rates between 20 and 70 years of age of about .5 #/1,000 surviving. Then, towards the 75 and 90 years range, the #/1000 surviving leveled out and became extremely similar in curves. Did people die younger before the influenza vaccine was created? In comparing survivorship curves a Log10 scale is used for its ability to show you greater numbers in a more readable way and to show same mortality with the same curve when two scales are put together. In a Log10 scale there are three Types of information. The first, Type 1, are mainly humans. Type I survivorship curves are characterized by high survival in early and middle life, followed by a rapid decline in survivorship in later life. Type 2 is mainly birds and Type 3 is mainly reptiles. Within these Types are two categories of species, K-Selected, or Equilibrium, species and R-Selected, or Opportunist, species. K-Selected species usually have stable resources and a stable environment, and this is usually what humans are categorized as. R-Selected species are usually whose population size tends to fluctuate greatly in reaction to variations in the environment. Comparing the survivorship curves, defined as a graph showing the number or proportion of individuals surviving at each age for a given species or group cohort, before and after the influenza vaccine was created will show if the vaccine helped increase the population. Before the 1940s when the influenza vaccine was created, the epidemic was particularly deadly in US Army training camps, where the death rate was as high as 80% in some camps. Death rate is usually calculated as the number of deaths per one thousand people per year. usually calculated as the number of deaths per one thousand people per year. The US military was getting hit with influenza the most forcing them to developed the first approved vaccine for influenza, which was used in the Second World War. Studying this specific survivorship curve will also help to tell if their were more survival rates in the US military during the time. Results With the original research question in mind, before the influenza vaccine was created people were dying younger. This question was answered by the survivorship curve graph comparing the curves before and after the influenza vaccine. As the graph shows between 20 and 70 years of age there is a significant difference in curves, meaning that the death rate before the vaccine in that time period was increased more than after the vaccine was created. From that specific area of the graph it can be concluded that people were dying younger before the influenza vaccine was created, thus the hypothesis was correct. For future study it would be interesting to see the survivorship curve in the US military before and after the vaccine not just the population in general. Because the US military was the one who invented it because they were the one being impacted with the death rate from the influenza epidemic the most, the survivorship curve would have a chance of being more predominant. Graph Clear Digital Media, Inc. (1997-2011). Cemetery Records Online. October 1, 2013, www.interment.net Genealogical Gleanings. (1997-2004). Plagues and Diseases. October 3, 2013, genealogical-gleanings.com/Plauges.htm Introduction

Bibliography Presentation

Transcript: Bibliography Presentation Understanding Research Sources and Citations Introduction to Bibliography Citation Formats Definition of Bibliography APA Style Importance of Bibliography MLA Style Other Formats Chicago Style Types of Bibliographies A bibliography is a comprehensive list of sources referenced in a research work. It typically includes books, articles, and online resources, formatted according to a specific citation style. The American Psychological Association (APA) style is commonly used in social sciences. Key features include author-date citation format, specific formatting guidelines for papers, and a reference page listing sources in alphabetical order. The Chicago Manual of Style offers two systems: Notes and Bibliography (used in humanities) and Author-Date (used in sciences). It allows for detailed footnotes and can accommodate a wide range of source types. Many academic fields adopt unique citation styles, like Harvard or Turabian, tailored to their specific needs. Each format has distinct rules on author order, publication dates, and source types. The Modern Language Association (MLA) style is prevalent in humanities, particularly literature and language studies. It emphasizes the author's name and page number for in-text citations, with a Works Cited page providing full source details. Bibliographies ensure proper credit is given to original authors, preventing plagiarism. They also enable readers to locate sources for further reading and foster academic integrity. Bibliographies can be categorized into various types including annotated, selective, and critical bibliographies. Each type serves different purposes in academic research and writing. Creating a Bibliography Essential Tools and Resources for Citation Gathering Sources Formatting Entries Online Citation Generators Library Resources Collecting sources involves identifying credible materials such as books, scholarly articles, and websites. Utilize library databases and search engines to find relevant information that supports your research topic. Each entry in a bibliography must adhere to specific formatting rules depending on the citation style used. Ensure correct punctuation, italics, and order of information to maintain uniformity. Educational Websites Citation Management Software Many libraries offer access to valuable citation guides, research databases, and reference management tools for patrons. Utilizing library resources maximizes access to quality materials and aids in accurate citation practices with professional assistance. Online citation generators like Citation Machine and EasyBib automate the process of creating citations in various formats. Users need only input the source details, and these tools generate accurate citations quickly, ensuring adherence to style guides. Educational platforms such as Purdue OWL and Citation Labs provide comprehensive guides and tutorials on citation styles. These websites offer examples and techniques for students to improve their bibliographic skills and adapt to different formatting requirements. Citation management software, such as EndNote and Mendeley, streamlines the organization and formatting of references. These tools allow researchers to store references, collaborate with others, and integrate citations directly into document editors. Organizing Information Common Mistakes to Avoid Avoiding common errors like incorrect author order, missing publication dates, and inconsistent formatting can enhance the quality of a bibliography. Double-check each entry to prevent omissions or inaccuracies. Once sources are gathered, organize them systematically. Create a list categorized by type, such as books, journals, and websites, ensuring ease of reference when compiling your bibliography.

Now you can make any subject more engaging and memorable