You're about to create your best presentation ever

Free Swim Lane Process Map Template Powerpoint

Create your presentation by reusing a template from our community or transition your PowerPoint deck into a visually compelling Prezi presentation.

Recycling Swim Lane Map

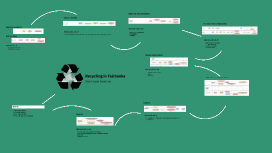
Transcript: Introduction to Recycling in Fairbanks Overview of Recycling Importance Recycling reduces waste in landfills, conserves natural resources, and saves energy. In Fairbanks, effective recycling practices can significantly mitigate environmental degradation, supporting long-term community resilience and sustainability. Environmental Impact The recycling process in Fairbanks helps decrease pollution and greenhouse gas emissions. Recycled materials often require less energy to process than new materials, supporting a healthier ecosystem in Alaska. Community Involvement Community engagement is vital in Fairbanks' recycling efforts. Local initiatives, awareness programs, and collaboration with residents ensure effective participation, enhancing recycling rates and fostering environmental responsibility. Recycling Swim Lane Map Swim Lane Map Overview Role of Swim Lane Maps in Recycling What is Swim Lane Mapping? Key Components of the Swim Lane Map Identifying Critical Stops The purpose of Swim Lane Maps in recycling is to identify and streamline the flow of materials and information. By providing a clear depiction of each step in the recycling process, these maps can highlight inefficiencies, ensuring effective management of resources and better end results. Analyzing Processes and Critical Stops in Fairbanks, Alaska Swim Lane Mapping visually represents processes by dividing tasks into lanes, each corresponding to different stakeholders or stages. This method simplifies complex processes and clarifies responsibilities, enhancing understanding and communication among all participants in the recycling journey. Key components of a Swim Lane Map include lanes for different stakeholders, clear delineation of tasks, and pathways indicating workflow. Incorporating metrics and data can provide insights on performance and processes, allowing for targeted improvements in the recycling system. Bottlenecks in Collection Sorting Challenges Bottlenecks in the collection process, such as inadequate scheduling and insufficient transportation resources, hinder the timely pickup of recyclable materials. Delays can result in contamination and reduced overall recycling rates, limiting the effectiveness of the program. Sorting recyclables accurately remains a challenge due to public confusion regarding recyclable materials. Improper sorting leads to contamination, making entire batches unviable for recycling, thereby increasing landfill waste and operational costs. Community Awareness and Education Processing Capacity Issues Processing facilities in Fairbanks often face capacity constraints, limiting the amount of material they can handle at one time. This can cause backlogs and delay the processing of incoming recyclables, ultimately impacting recycling efficiency. Community awareness of recycling protocols is crucial to success. Educational programs aimed at informing residents about proper recycling practices can significantly reduce contamination rates and improve participation in recycling initiatives. Key Processes in the Recycling System Collection Methods Sorting Procedures In Fairbanks, recycling collection involves curbside pickups, drop-off stations, and community collection events. Utilizing diverse collection methods accommodates residents' varying participation levels and preferences, ensuring more recyclables are captured effectively. Processing Plants Post-collection, recyclables undergo sorting to separate materials into categories such as plastic, glass, and metal. Effective sorting procedures minimize contamination, allowing better processing rates and improving the final quality of recycled materials. Distribution of Recycled Materials Processing plants in Fairbanks convert sorted materials into reusable products through various methods such as shredding, melting, and repurposing. These plants play a vital role in transforming waste into new materials, thus closing the recycling loop. After processing, recycled materials are distributed to manufacturers for reuse in creating new products. This distribution ensures that recycled content reintegrates into the economy, promoting sustainability and reducing the need for virgin materials.

Recycling Swim Lane Map

Transcript: Introduction to Recycling Swim Lane Map Overview Importance of Recycling Recycling reduces the need for raw materials, conserving natural resources such as timber, water, and minerals. It also decreases energy consumption and greenhouse gas emissions, playing a crucial role in combating climate change. Definition of Swim Lane Map Common Materials for Recycling Purpose of Swim Lane Maps in Recycling Materials commonly recycled include paper, glass, metals, plastics, and electronics. Each material has specific recycling processes, emphasizing the need for proper segregation for effective recycling. A Swim Lane Map is a visual tool used to delineate processes across different stakeholders or departments. It organizes activities into lanes, allowing for a clear understanding of responsibilities and workflow sequences in recycling operations. Swim Lane Maps facilitate communication by providing a clear depiction of the recycling process. They enhance understanding among team members by outlining each participant's role, ensuring accountability and efficiency in recycling initiatives. Environmental Benefits Recycling helps to reduce landfill waste and pollution while conserving ecosystems. Proper recycling practices can reduce hazardous material release into the environment, safeguarding wildlife and human health. Overview of Recycling Process Key Components of Swim Lane Maps Visual Representation of Processes The recycling process typically involves collection, sorting, processing, and returning products to the market. Each stage is crucial for ensuring materials are recycled efficiently and sustainably. Recycling Swim Lane Map Economic Advantages Key components include lanes for each participant, process steps, and decision points. Each lane represents a department or role, helping to identify who is responsible for which part of the recycling process, thus streamlining operations. Swim Lane Maps provide a clear visual workflow, illustrating how materials flow through various recycling stages. This visual clarity improves stakeholder engagement, promoting a collective understanding of the entire recycling process. The recycling industry creates millions of jobs and generates substantial revenue. For every job in recycling, approximately 1.17 jobs are created in manufacturing, showcasing its economic impact. Applications in Recycling These maps are applied in tracking the recycling journey of materials from collection to processing. They help in identifying bottlenecks in the process that may affect efficiency and sustainability. A Comprehensive Guide to Efficient Recycling Processes Detailed Recycling Processes Processing and Manufacturing Collection Process The processing stage transforms sorted materials into usable forms, involving shredding, melting, or pulping. This step is crucial as it prepares materials for manufacturing new products, emphasizing the importance of clean and sorted recyclables. The collection process is the first step in recycling, involving the gathering of recyclable materials from various sources. Collection can occur through curbside bins, drop-off centers, or specialized recycling programs to ensure efficient retrieval of materials for processing. Education and Awareness Education plays a pivotal role in successful recycling initiatives. By informing the public about recycling practices and the benefits of participation, communities can increase recycling rates and reduce contamination, thus enhancing efficiency. Sorting Process Distribution and Sales After collection, recyclables undergo sorting to separate materials based on type and quality. Advanced technologies such as conveyor belts, magnets, and optical scanners are employed to enhance accuracy and efficiency, reducing contamination rates. Processed materials are sold to manufacturers who use them in production. Understanding market demand is vital as it dictates the economic viability of recycling efforts and influences the types of materials recycled.

Swim Lane Process Map for a Medical Procedure

Transcript: https://www.google.com/imgres?imgurl=https%3A%2F%2Fpbs.twimg.com%2Fprofile_images%2F958571805396078592%2F5bUjYVtg_400x400.jpg&imgrefurl=https%3A%2F%2Ftwitter.com%2Fanshetah&docid=Eof20NdPP5cNjM&tbnid=TA94iiAlqW28zM%3A&vet=10ahUKEwioj5mF1N3gAhWcAGMBHT_1A_EQMwg-KAAwAA..i&w=239&h=239&safe=strict&client=safari&bih=748&biw=689&q=شعار%20pnu&ved=0ahUKEwioj5mF1N3gAhWcAGMBHT_1A_EQMwg-KAAwAA&iact=mrc&uact=8 section: 6Q3 28/2/2019 supply chain management Swim Lane Process Map for a Medical Procedure About case study About Swim lane process: C. Hospital. Mapping process that shows a clear workflow for each working party Example: Preforming a surgery: B. Surgeon. A. Penitent. Example Working Sections: Working Sections: Horizontal: Department, Person and Material. Arrows\ Symbols: show each party its Destination. Q1 Q1- who or what org. is responsible for the process from start to finish ? And what are the implications for managenig and improving the treatment process? responsible The hospital is responsible for the surgery. Improving business processes: is at very core of operations and supply chain management. performance levels of most processes tend to decrease over unless forces are exerted to maintain it. Even if an org does not feel a need to improve it's business processes, it may be forced due to competitive pressure. measuring business first understand the customer wants and calculate objective performance information for the process measuring business process performance Measure of process performance Measure of process Quality: performance quality, conformance quality and reliability Flexibillity: mix,changeover, and volume flexibility. cost: labor, material, and quality related costs. Productivity: (ratio of outputs to input) Time: delivery speed and delivery relibility. Efficiency: (the ratio of actual outputs to standard outputs) 100% X (actual outputs/standard outputs). Cycle or (throughout) time (total elapsed time needed to complete a business process. Company Intro Which process steps should be standardized? Registration and appointment. Radiology process. Communication process. FLOW CHART CREATION APPS The Brief WHICH PROCESS SHOULD BE MORE ARTISTIC 3. Consider the errors that occurred during the treatment process. How might you use the Six Sigma methodology and continuous improvement tools to keep these errors from reoccurring? Looking ahead, what kinds of solutions might you see coming out of such an analysis? Strategy Solution Before taking any action on the patient, be sure to correct the necessary information, there should be careful and a lot of scrutiny. Using Six Sigma methodology in which the main steps are to analyze, improve and control the process. In all operations, we need this methodology because it seeks to improve by identifying and eliminating the causes of errors. It will enable us to control errors and solve them. It helps us to obtain accuracy as well as control errors. This reduces cost and increases profit. Members work the manager can control the number of errors that occur significantly. Continuous training in hospital procedures will help us prevent future errors. Video Video we faced some difficulities but we overcame it by external reading and at the end we want to introduce these apps that may help you in creating swim lane flow chart in an easy and beautiful way Conclusion program IDEAMENT INSPIRATION FLOWDIA DIAGRAMS ILUCID CHART program OUR TEAM 1- Athari alshammari 437004848 2- Rahaf AlGhunaim 436000213 3- Ashwaq Alshamari 437004457 4- Raghad Alshowyair 437004334 5- Raneem Alrashoud 437004461 6- Lojin Zuhair Rahbeeni 437004907 7-Bayan Fahd Alessa 437004196 OUR TEAM

powerpoint template

Transcript: Nobody knows babies like we do! Quality products . Good Customer service. Every Kid really loves this store.. BABYLOU ABOUT US About Us BabyLou was established in 2004. It has been more than a decade since we started, where we have ensured to take care of every need and want of every child and infant under one roof, true to the caption “NO BODY KNOWS BABIES LIKE WE DO”. Our benchmark is to provide 100% customer service and satisfaction and continue to deliver the same with a wide range of toys, garments and Baby Products. Play and Create We Are Best 01 02 03 Block games Building Blocks help Kids to use their brain. PLAY TO LEARN in Crusing Adventures Our Discoveries Enjoy a sunny vacation aboard a luxury yacht with the LEGO® Creator 3in1 31083 Cruising Adventures set. This ship has all the comforts you need, including a well-equipped cabin and a toilet. Sail away to a sunny bay and take the cool water scooter to the beach. Build a sandcastle, enjoy a picnic, go surfing or check out the cute sea creatures before you head back to the yacht for a spot of fishing. Escape into the mountains Disney Little Princes in Also available for your Babies..... Also... Out of The World… Our reponsibility BABYLOU…. Our Responsibility All children have the right to fun, creative and engaging play experiences. Play is essential because when children play, they learn. As a provider of play experiences, we must ensure that our behaviour and actions are responsible towards all children and towards our stakeholders, society and the environment. We are committed to continue earning the trust our stakeholders place in us, and we are always inspired by children to be the best we can be. Innovate for children We aim to inspire children through our unique playful learning experiences and to play an active role in making a global difference on product safety while being dedicated promoters of responsibility towards children.

Now you can make any subject more engaging and memorable