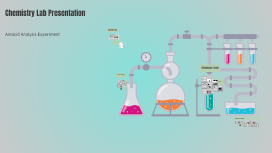
Chemistry Lab Presentation
Transcript: Chemistry Lab Presentation Introduction Experiment 18- Antacid Analysis Antacid Analysis Experiment Presented by Chiedu Clarke and Chase Gillespie. This lab presentation delves into Experiment 18, which focuses on analyzing the antacid's effectiveness in neutralizing stomach acidity. Understanding this process is crucial for advancements in digestive health and pharmaceutical applications. Experiment Objective The primary objective of this experiment is to evaluate how effectively antacids neutralize hydrochloric acid. By measuring the titration of acid and base solutions, we assess the potency and efficiency of various antacid compounds in providing relief from digestive discomfort. Neutralization reactions involving these 2 antacids follow this general format: CaCO3(s)+2HCl(aq)--->CaCl2(aq)+H2O(l)+CO2(g) Mg(OH)2(s)+2HCl(aq)---->MgCl2(aq)+2H2O(l) Chemicals Used Apparatus and Supplies 0.1 M Hydrochloric Acid (HCl) Erlenmeyer Flask Pipet Hydrochloric acid is a colorless, strong acid, highly soluble in water, used to simulate stomach acid in this experiment. It plays a vital role in reacting with the antacid to assess its neutralizing capacity. The 250 mL Erlenmeyer flask is designed for mixing and heating solutions. Its conical shape minimizes evaporation and allows for easy swirling during reactions. A pipet is an essential tool for precise measurement and transfer of liquid reagents. Different types include volumetric and graduated pipets, each suited for specific tasks. Calcium Carbonate (CaCO3) Scale Buret Calcium carbonate is a white solid that acts as the main antacid in this experiment. It neutralizes hydrochloric acid, providing relief from acidity, and is commonly found in antacid formulations. A digital scale is used to measure the mass of solid chemicals accurately. Precision in weighing is critical to ensure reproducibility and accuracy in experiments. The 50 mL buret facilitates accurate dispensing of titrant solutions. Its design allows for fine control of liquid delivery, making it indispensable in titrations. 0.1 M Sodium Hydroxide (NaOH) Kim Wipe Hot Plate Kim Wipes are lint-free tissue paper used for cleaning equipment and wiping spills. They are essential for maintaining a sterile and clutter-free work environment. The hot plate provides controlled heating for solving and maintaining reaction temperatures. It offers safety advantages over traditional Bunsen burners, especially in enclosed settings. Sodium hydroxide is a white crystalline solid and a strong base, used here for titration. Its function is to neutralize excess hydrochloric acid to determine the effectiveness of the antacid. Milk of Magnesia Mg(OH)2 Dropper A dropper allows for the precise addition of small volumes of liquids, crucial for developing chemical reactions or titration endpoints without overshooting. Milk of magnesia is a viscous white liquid containing magnesium hydroxide, serving as another antacid option. It helps to relieve stomach discomfort by neutralizing acid effectively and is often recommended for indigestion. Bromophenol Blue Bromophenol blue is an indicator reagent that changes color based on pH levels. In this experiment, it signals when the solution transitions from acidic to neutral or slightly basic, guiding the titration process. Experiment Procedure HCl Addition and Heating Indicator Addition Mass Measurement of Flask Calcium Carbonate Preparation Using a pipet, add 25 mL of 0.1 M hydrochloric acid to the flask containing calcium carbonate. Gently swirl to mix, then heat the solution to a gentle boil for one minute to initiate the reaction. Begin by measuring the mass of an empty 250 mL Erlenmeyer flask using a precision scale to ensure accuracy in subsequent calculations. Record the mass for use in determining the amount of calcium carbonate added. After heating, add 4 to 8 drops of bromophenol blue indicator to the solution. If the solution turns blue, additional hydrochloric acid must be added Tare a weigh boat and add approximately 0.2 g of calcium carbonate, recording the exact mass. This compound will be reacted with hydrochloric acid to study its neutralizing capabilities. Observations and Results Final Analysis and Conclusion Possible Errors in Experiment Titration with NaOH Ask any questions, comments, or clarification Once cooled, titrate the reacted solution with sodium hydroxide (NaOH) to reach a light blue endpoint. Record the initial and final buret volumes to calculate the amount of NaOH used in neutralization. Heated flask to 550°C, causing condensation and CO2 to escape. Added 8 drops of bromophenol indicator; solution stayed clear (basic). Started titration with NaOH; initial clear purple showed we were close to the endpoint. Adding more NaOH turned it deep blue, confirming we reached the endpoint. Document all observations during the experiment, particularly any changes in color, demeanor of the reactants, and the final volume readings from the buret after titration. These