You're about to create your best presentation ever

Financial Statement Powerpoint Presentation Template

Create your presentation by reusing a template from our community or transition your PowerPoint deck into a visually compelling Prezi presentation.

Financial Statement

Transcript: Financial Statement Balance Sheet The purpose of a balance sheet is to provide an individual with data about a company's assets, liabilities, and shareholders' equity The Balance Sheet Formula is Assets = Liabilities + Shareholders' Equity Assets The possessions of a company that actually have a certain value Assets are typically sold and used by businesses to begin the production of goods and services which can then be used to bring in revenue Assets can be physical possessions such as: money, and equipment; or non-physical possessions such as: patents, and trademarks 3 Types of Assets -Current Assets: What a business wants to trade in for money within one years time -Non-Current Assets: What a business does not want to tarde in for money within one year/ or take longer than one year to sell -Fixed Assets: Assets used to operate the business and not for sale (trucks) Liabilities The debt of one company to another company including things such as rent, loans, etc. Two Types of Liabilities: -Current Liabilities: What a business wants to pay off in one years time -Long-Term Liabilities: Debts that a business expects to pay off in more than one years time ShareHolders' Equity How much individuals invest into the company added/subtracted the earnings/Losses of the company Often called and referred to as capital The money remaining after all liabilities and debt is payed This money belongs to shareholders, and owners of the business Dividends: earnings that are circulated Income Statement Report displaying the profit a company has obtained within a particular period of time In addition, an income statement shows how this profit was earned Show Earnings per share (EPS) which sates how much shareholders would receive if a business circulates all of its net earning (Even earnings are distributed, shareholders typically reinvest) At the top of the Income Statement is all the sales that the company has made in a specific time period (Gross Revenue) The next line of the Income Statement is profit that businesses do not collect As you move down the Income Statement, deductions for obtaining the sales are calculated in At the bottom of the Income Statement, is the net profit/revenue The line below net revenue display the sales costswhich are substracted from net profit to have "gross profit/margin" After gross profit are the deductions of operating expenses and depreciation (aging of assets such as machinery); this gives you "Income from Operations" Finally, after adding in interest income/expense and substracting income tax your final profit/loss statement appears

Financial Statement

Transcript: Vertical Analysis Balance Sheet Horizontal Ratios Balance Sheet Areas of Focus Background Competitor Ratio Analysis Significant Risk Factors Investor Ratios - Days Sales in Receivables significantly increase from 2016 to 2017 indicating that credit sales on average took about four more days to be collected - Days Sales in inventory significantly decreased from 2016 to 2017 - The operating cycle went up by 10% from 2016 and 2017 and went down 9% in 2018. - Working capital increased significantly from 2017 to 2018 - Sales to working capital however, decreased by almost 40% from 2017 to 2018 - Income before income taxes increased materially in 2018 - Taxes related to operations remained steady Net-Income increased materially in 2018 - The material increase in Income before income taxes and Net Income in 2018 were related to the following: - AWS - Smart Speaker market - Fulfillment - Taxes related to operations remained steady because of the no taxation - Shift focus from competitors to customer loyalty. - Investments aimed towards making system clearer and more efficient. - Making bundles of products to produce more sales to a single company. - Faster delivery and vertical integration. - Unlimited selection of products and services. Value of Firm - Cash made up more of current assets in 2016 than 2017 - More Long-Term Assets than Short Term Assets in 2016 as compared to 2017 - Total Current Liabilities decreased in 2016 to 2017 and Long-Term debt made up more of the liabilities - Total Equity also increased about 5% Tech: Apple Web Services: Microsoft E-Commerce: Walmart Logistics: Fed-Ex Vertical Analysis Income Statement How do We Stay Relevant Liquidity Analysis - Ensure low prices and high volumes of inventory - Make small margins over larger volumes for expansion purposes. - Fulfillment centers get more efficient through innovation - Precise and quality deliveries - Customer loyalty via Amazon Prime Financial Statement Analysis - Interest Rate Risks - Foreign Exchange Risks - Investment Risks - Inventory shortage risks - Amazon’s Working Capital is significantly lower than the industry average meaning that they cannot cover current liabilities so easily in comparison to other companies in the industry. - Days Sales in Receivables is 10 days longer than the industry average showing that amazon needs to find ways to collect faster. - Amazon’s debt ratio is lower than their industries average. - Total asset turnover is lower than industry average showing that their assets are not generating as much sales as it should be. - Cash went up by approximately 60% from - Long- Term went up by 220% from 2016 to 2017 and went down 20% right after - Other long-term liabilities went up each year by 50%. Directly related to Unearned Revenue - Common equity went up by 75% from 2017-2018 Competition In Different Industries Company Strategies... Data Failure Large amount of data can undergo: - Unavailability - Failure to respond - Slow service - Deter customers from using Amazon 1) Partnership and Acquisition 2) Affiliate Programs 3) Multi-level sales strategy - Focus on business to customer (B2C) - Customer to Customer (enable anyone to sell) - Easy Exposure to sellers, helps customers save on marketing & promotions - Cross- selling - Founded in 1994 by Jeff Bezos as an online bookstore - Corporate offices are located in Seattle, Washington - World's largest e-commerce marketplace - Specialized in other segments such as cloud, computing, artificial intelligence, video/audio downloads and streaming, software, furniture, publishing and technological innovation Horizontal Ratios Income Statement Competition Other companies may have: 1. Stronger resources, 2. Longer history, 3. More customers, 4. Greater brand recognition. 5. Better terms with vendors, 6. Adopt more aggressive pricing, 7. Devote more resources to technology, infrastructure,fulfillment, and marketing Inventory - Seasonality - Launch of new product - Changes in cycles and pricing - Defective merchandise - Change in consumers taste - Net profit margin increased materially in 2018. - Operating income margin decreased slightly in 2017 but increased materially in 2018 - Return on operating assets materially decreased in 2017 but materially increased in 2018 - Return on Total Equity decreased materially in 2017 but significantly increased materially in 2018 - Return on Common Equity decreased materially in 2017 but significantly increased materially in 2018 - In 2018 Amazon’s value was ~ $1 trillion market capitalization - In 2019 it remains the top internet company (takes between 2nd or 3rd position as one of most valuable) - Main strategy- GROWTH over profits Focus on long-term (such as customer acquisition) - Has high market valuation and continues to GROW Long Term Debt-Paying Ratios - Material increases in Gross Profit, Net Sales(cash received from customers and other activities), Operating Expenses, Operating Income, Interest Expense, Income before taxes, and

FINANCIAL STATEMENT

Transcript: Revenues (Sales, Services & Interest Revenues) Expenses (Salaries, Utility & Interest Exp) Examples: Accounts Payable, Unearned Revenues & Bonds Payable Liabilities Company's Owes 1. Start with net income 2. adjust net income for non-cash exp & gains 3. recognize cash inflows ( outflow) form changes in current assets & liabilities 4. sum to yield net cash flows from operating activities 5. change in long-term assets yield net cash flow from investing activities 6. change in long- term liabilities & equity accounts yield net cash flow from financing 7. sum cash flow operating, investing & financing activities to yield net change in cash 8. add net change in cash to the beginning cash balance to yield ending cash Sale of machinery purchase of fixture & machinery purchase of truck net cash use by investing activities cash at beginning of period cash at end of period LONG-TERM MONEY INCOME STATEMENT The first statement prepared is the Income Statement. The Income Statement reports a business’ performance for the period. Cash Flow form Operating Activities Cost of goods sold (buy or made products for resale) Current Liabilities + Long-Term Liabilities = Total Liabilities Note to self : The balance sheet must be prepared after the statement of retained earning in order to have calculated the ending of retained earning Cash Flow from Investing Activities Depreciation Expense Example: mortgage payable & bonds payable EXAMPLE sale of stock treasury stock net cash used by financing activities Income Taxes (Income before taxes x Income Tax Rate) Revenue less Cost of Goods equals Gross Profit Assets = Liabilities + Equity Examples : long-term investments, land, equipment & patents FAST MONEY Indirect and Other Expenses Losses that doesn't relate to company's operation Example: Cash, Accounts Receivable, Supplies, Buildings ASSETS Net increase in cash Liabilities Contributed Capital Amount of cash ( or other assets) provided by the shareholders Cash Flow FINANCIAL STATEMENT Examples: cash, accounts receivable, inventory's, short-term investments, supplies & prepaid Salaries & wages Advertising Office supplies Beginning Inventory New Goods Produced Closing Inventory NON-Operating Expenses Equity Owners Contribution / Residual Balance ASSETS - LIABILITIES = Equity BY ARBIND KUMAR Current Assets will be used or turned into cash within a year Current Asset + Fixed Assets = Total Assets Sale Revenues ( Commodity Sales ) Fee Revenues (Services) Fixed Assets comprise the remainder of the assets Assets Things that company owns Steps in Constructing the Statement Definitions Current liabilities paid in cash or satisfied by providing service within the year Net Income- Retain Earning (income after taxes) Cash Flows form Financing Activities Long-Term liabilities not paid or satisfied within the year Equity common stock & additional paid in capital are account in this section Example: account payable, short-term payable, taxes payable Net income adjustment to reconcile net income to net cash provided by operating activities Loss on sale of machinery increase in accounts receivable decrease in inventions increase in account payable net cash provided by operating activities Balance Sheet Retained Earnings total earnings that have not been distributed to owners as dividends CASH FLOW CONT........ Operating Expenses (Direct Expense Related to Business Operations) Net Profit Before Tax (EBIT - Earnings Before Tax) Shows how a company operates, invests, & finances its activities that affects cash during an accounting period

Financial Statement Presentation

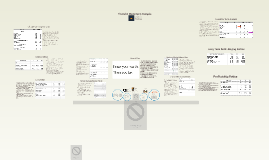
Transcript: As of September 2013, cash equivalents were $4644 which is $1116 more than September 2012 What was the change in dollars in the companies net income from it's most recent reporting period to the previous reporting period? Net income in September 2013 ~ $617 million compared to $609 million from September 2012 Why? continued IT spending and or healthcare related expenses" Net sales for the 53-week fiscal year were up 111⁄2 percent, to $97 billion, from the prior 52-week fiscal year sales of $87 billion; and adjusting for the extra week, up 91⁄2 percent. Comparable sales in warehouses open more than one year increased seven percent. By: Anhthy Tran, Amanda Tofaeono, Savannah Hernandez, Lisa Delgado, Liliya Vinnichuk. Amount of accounts payable the company had at the end of it's most recent reporting period Accounts Payable: September 2012: 7,303 million September 2013: 7,872 million What might have caused the change? In 2012 there was less expenses then by September of 2013. Cost Expenses: 2012: 28,210 million 2013: 28,418 million Administrative Expense : 2012: 3,044 million 2013: 3,098 million Costco's stock trade as of now is at $125.70 a share. Even though Costco had a very slow year this year, their business is always growing as well as their stock. I would say buy on the company stock because most of their profit comes from their memberships which has increased by the millions in just the past 5 years! What were the companies net revenues from the last three reporting periods? Most recent- Sep 2 2013 ~ 30,283,000 billion Previous- Sep 1 2012 ~ 27,140,000 billion Reasons for increase Rasied membership prices boosted income by 8% Seven new warehouses opening 19% increase in memberships Accounts Payable: September 2012: 7,303 million September 2013: 7,872 million What might have caused the change? In 2012 there was less expenses then by September of 2013. Cost Expenses: 2012: 28,210 million 2013: 28,418 million Administrative Expense : 2012: 3,044 million 2013: 3,098 million Financial Statement Presentation Amount of accounts payable the company had at the previous reporting period Previous Reporting Period. Total assets at the end of the most recent and previous reporting period. Previous- Sep 1 2012 ~ 27,140,000 billion Amount of cash and cash equivalents that the company had at the end of the most recent reporting period What was the companies stock trading for on the day prior to your presentation?

FINANCIAL STATEMENT

Transcript: An income statement is your written accounting system that balances your spending and your income . This record will show whether your restaurant is making a profi t or taking a loss. This P&L will show you monthly sales and expenses as well as annual variances. All your expenses will be broken into categories, such as food, beverage, kitchen items, and labor. Within each category you will have subcategories describing each expense. Often, companies have accounting codes assigned to each item purchased so they can have a clear idea of where they are spending money to operate the business. When a business is struggling, the owner will often make cuts rather than control and reorganize. You have to determine what is not working for you and cut back by controlling your costs. If you are still having trouble after a short period of reorganizing, you may actually have to make cuts. An example of control is labor costs. Labor is most likely going to be your highest expense. You can control your labor costs by staffi ng accordingly and ensuring that people are working when they are on the clock rather than standing around talking. As you look at your chart of expenses, some are investments that keep the sales in place. Advertising is one of the fi rst expenses that an operator looks to cut, and often that cut reduces revenue and sales, which in turn causes a further erosion of profi t. In the kitchen, ensure you are only buying what you need. Make sure your cooks are apportioning food properly and you are controlling waste. Anything wasted is an unnecessary expense. Example Have a plan and create a program that allows you to clearly understand where to cut and where to control. a. have a plan Select and analyze financial reports Find the question b. where to cut Can buy can don’t by the goods Customers like medium goods c. where to control High sales of goods Low sales of goods The attitude of service is also important. We are in hospitality industry and people expect good service. Generally, customers like to go to the service attitude good place to eat. provides more detailed information Sometimes you need to view your P&L.Last you need offer full P&L. covers a period of time cash balance Judging What to Cut The main purpose of the balance sheet is to show what your business owns and owes at a given point in time. Using a Declining Budget for Weekly Expenditure An excellent tool for monitoring expenses and staying within the guidelines of your monthly P&L is a declining budget worksheet. This allows you to track your total expenses for the month. Keeping track of your spending allows you to stay within budget. BY: GROUP 1 Income Statements on a particular date show important assets You will want to be sure that you are tracking all costs and salted for accuracy and ensure. FINANCIAL STATEMENTS balance sheet P&L Statement The different between the balance sheet and the income statement help you control measurements and waste Conclusion When to Cut Back Versus When to Control Judging What to Cut Clarity in the Statement Generate and Understand a P&L Statement The Balance Sheet Using Technology OUTLINE In this lesson, you should learn how to use management information to guide business decisions. And learn how to select and analyze financial reports to guide spending in marketing, inventory, staffing, etc. Realize you are in a position that requires you to make cuts. Can’t afford the staffs’ salary Income is slapping down little profit Can’t attract many customers bank loan Example of a declining budget spreadsheet. Income Statements Using a Declining Budget for Weekly Expenditure When to Cut Back Versus When to Control much of the information in your PC and POS are compatible and provide you with data Future indications The Balance Sheet If you are a small operation .If you are a larger operation,You should use an accountant and to create the right program. inventory The declining budget will provide you with a tool for success and allow you to keep track of your P&L. It will also allow you the opportunity to be successful and knowledgeable about your business. This is YOUR responsibility; no one else can do it. Using Technology You need keep your profit and loss statement simple. How frequently should we look at particular reports? Also, you must determine how often you want to run your profit and loss statement. With modern accounting software. income statement When making a particular decision , which reports and data are relevant? Clarity in the statement

Now you can make any subject more engaging and memorable