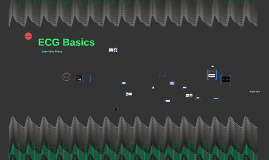
ECG
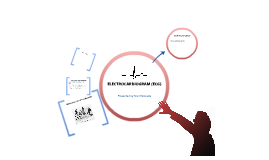
Transcript: Electrocardiographic Lead Systems Recording electrodes are configured to form various types of leads A lead records the fluctuation in extracellular voltage generated between its electrodes The standard clinical ECG includes recordings from 12 leads 6 in the frontal plane 3 bipolar leads or standard limb leads 3 modified (augmented) unipolar limb leads 6 in the transverse plane the unipolar precordial leads Limb leads Lead I -negative connection to right arm, positive connection to left arm -defines an axis in the frontal plane at 0 Lead II -negative to right arm, positive to left leg -defines an axis in the frontal plane at 60 Lead III -negative connection to left arm, positive connection to left leg -defines an axis in the frontal plane at 120 -The output – the potential difference between two limbs ECG Leads - Overview Each lead is an axis in one of the planes (frontal, transverse, sagittal) onto which the heart projects its electrical activity Each lead looks at the heart from a unique angle and plane it has its own unique point of view The recording from a single lead shows how that lead views the time-dependent changes in voltage of the heart Arrhythmias Conduction disturbances Myocardial ischemia Cardiac enlargement and hypertrophy Electrolyte disturbances Increased susceptibility to sudden death (QT-prolongation syndromes) Q wave: - Represents depolarisation in the septum. - The picture below shows this small negative wave immediately before the large QRS complex. Whilst the electrical stimulus passes through the bundle of His, and before it separates down the two bundle branches, it starts to depolarise the septum from left to right (shown by arrows). This is only a small amount of conduction (hence the Q wave is less than 2 small squares), It travels in the opposite direction to the main conduction (which is right to left) so the Q wave points in the opposite direction to the large QRS complex. P Wave R wave: As shown in the diagram; the R wave represents the electrical stimulus as it passes through the main portion of the ventricular walls. - The wall of the ventricles are very thick due to the amount of work they have to do and, consequently, more voltage is required. This is why the R wave is by far the biggest wave generated during normal conduction. More muscle means more cells. More cells mean more electricity . More electricity leads to a bigger wave. From Heart Vectors to ECG Waves The amplitude and polarity of the cardiac potentials sensed in a lead are proportional to the size of the projection of the heart vector on the lead vector a.The projection of the heart vector points toward the positive pole of the lead, the lead records a positive potential positive wave on ECG b.The projection is directed away from the positive pole of the lead the lead records a negative potential negative wave on ECG QRS Complex Nomenclature Q wave -Initial downward deflection -Duration: < 0.03 – 0.04 s; exception: in lead V1, V2 any Q is abnormal -Amplitude: < ¼ R wave, < 0.2 – 0.3 mV R wave -First upward deflection -Criteria for shape or size are not absolute; high amplitude in V5, V6 -A second upward deflection is designated R’ S wave -The second negative deflection if there is a Q wave, or the first downward deflection if not -Duration: < 0.04 s -High amplitude in V1, V2 = Repolarisation of ventricles Generally T wave = positive This is due to the repolarization of the membrane. (QRS wave), the heart depolarizes. Repolarization of the ventricle happens in the opposite direction of depolarization and is negative current. This double negative (direction and charge) is why the T wave is positive; although the cell becomes more negatively charged, the net effect is in the positive direction, and the ECG reports this as a positive spike. T-wave inversion (negative T waves) can be a sign of coronary ischemia, Wellens' syndrome, left ventricular hypertrophy, or CNS disorder. Tall and narrow ("peaked" or "tented") symmetrical T waves may indicate hyperkalemia. Flat T waves (less than 1 mV in the limb leads and less than 2 mV in the precordial leads) may indicate coronary ischemia or hypokalemia QRS WAVE: Definition: Represents ventricular depolarisation Description: At this point the electrical stimulus passes from the bundle of His into the bundle branches and Purkinje fibres. The amount of electrical energy generated is recorded as the QRS complex. More voltage is required to cause ventricular contraction and therefore the wave is much bigger. A non-invasive test of the electrical activity of heart's conduction system, which is transformed into recordings on graph paper – an electrocardiograph S wave: This is a small negative wave after the large R wave which represents depolarisation in the Purkinje fibres. The S wave travels in the opposite direction to the large R wave because, as can be seen on the earlier picture, the Purkinje fibres spread throughout the ventricles from top to bottom and then back up