You're about to create your best presentation ever

Download Ieee Presentation Template

Create your presentation by reusing one of our great community templates.

IEEE presentation

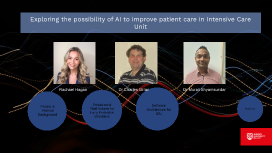
Transcript: Exploring the possibility of AI to improve patient care in Intensive Care Unit Rachael Hagan Dr Murali Shyamsundar Dr Charles Gillan Project & Medical Background Project & Medical Background Medical background Medical Background Mechanical ventilation is a life saving tool and provides organ support for patients with respiratory failure. However, injurious ventilation can occur due to inappropriate delivery of high tidal volume leading to damage of the alveoli. Tidal Volume: measure of the volume of air delivered to a patient during mechanical ventilation. A decision support tool that can predict breaches in the tidal volume threshold could lead to decreased mortality and better utilisation of ventilatory resources. Project The Project This work originated from the VILIAlert system as part of the NanoStreams project (2013-17) funded by the European Commission under its FrameWork 7 Programme for research and technological development (RTD). VILIAlert monitors patients ventilator settings in real-time and alerts clinicians if threshold is breached repeatedly (period of 60 minutes). Data Aquisition took place at the Royal Victoria Hospital, Belfast for nearly 3 years. Recording around 4 million per minute Tidal Volume readings for almost one thousand patients. Prediction of Tidal Volume for Lung Protective Ventilation Prediction of Tidal Volume for Lung Protective Ventilation Methods Time Series For each patient we take 15 minute averaged bins of tidal volume to smooth the random fluctuations in the data. We aim to predict the tidal volume profile 1 hour ahead in order to give clinicians enough time for intervention to promote lung protective ventilation. Regression & Ensemble Learners When we have a time series (continuous data), we can analyse the relationship between the measured value and time in order to predict future values. We utilise the Python tsfresh package to extract features to use as input into our predictive model. The features extracted from the time series are inputted into an Ensemble Learner such as an AdaBoostRegressor/BaggingRegressor. Multiple predictions are made and combined in different ways in order to improve the accuracy of the prediction. E.g. for an AdaBoostRegressor multiple and complicated decision trees are made to estimate the next value. The trees are built sequentially, where the weights of instances are adjusted according to the error of the current prediction. Bagging and Boosting trees Bagging methods: Bagging ExtraTrees RandomForest Boosting methods: AdaBoost GradientBoosting Set the max number of trees in each model to 10 to prevent overfitting. Explored the mean depth of trees in bagging regressors. Boosted methods create trees of depth 4, increasing number of trees decreases RMSE. Long short-term memory Neural Network A form of recurrent neural networks. Well-suited to classifying, processing and making predictions based on time series data, since they can store information over longer periods. Work directly with the time bins and observed values rather than features. Split into 70% training data and 30% test data per patient. LSTM Neural Network ESPRC Kelvin Supercomputer to train and test our LSTM Neural Network models for prediction. We investigated 2 models: 1 layer LSTM and 3 layer LSTM. Each layer has 50 nodes. We trained the models for 500 epochs, used the relu activation function and the adam optimizer. Use 20 input points to predict 4 ahead. Results Results 1 time step ahead Regression Predicting 1 time step ahead (15 mins): Regression Regression Predicting 4 time steps ahead (1 hour): 1 of the decision trees created from AdaBoost regression: LSTM Neural Network LSTM Neural Network Both LSTM models have 20% dropout layer to avoid overfitting and each layer has 50 nodes. Any more layers resulted in training times exceeding 24 hours. We split each time series in 70% training and 30% test sets to build the LSTM models. Predicting Alerts Prediction of Alerts We compare our predicted alerts with the alerts generated from the VILIAlert system. Differences are due to LSTM model only being tested on the 30% test data per patient. True Positives (TP) = Alerts correctly predicted False Negatives (FN) = Alerts that would not have been predicted Probability of Detection = TP/(​​TP+FN​) Probability of Detection = 0.89 Software Architecture for ICU Software Architecture for ICU Trust Server Belfast Trust Server Virtual server set up within the Belfast Trust. Records all ICU data from Royal, City and Matter Hospitals. Has been recording data since beginning of April. NHS has been recording a large set of anonymised data since March 2020, covering 1380 patients, growing at a rate of approximately 100 GB per month. We submitted an IRAS protocol application to be granted access to this data. The server is set up with a MySQL database as it can be a client of MicrosoftSQL server, as used by Cardiac Services who are providing the data. We are routinely collecting lab results,

IEEE Presentation

Transcript: Presented by M.Elmahi & E.Mustafa INTELLIGENT ANALYTICS ” Our ability to do great things with data will make a real difference in every aspect of our lives.” – Jennifer Pahlka, Founder and Executive Director of Code for America What is IA IA is a statistical consultancy and training agency that aims to raise individuals and organizations knowledge about the power of statistics What is IA Aim To emphasize an integrated, comprehensive statistical consulting service, covering a wide range of projects and services ranging from (quantitative research in all aspects of project from the initial study design through to the presentation of the final result and findings). Aim Vision Vision To be leader in providing sophisticated statistical consultation services. To be leading statistical training and consultancy company. To provide high-quality statistical services. Mission Mission Interactive learning process with our clients. To promote the knowledge and use of Statistics in all fields To facilitate research, discussion, planning and decision making. To promote a user-based culture. Service Our Services We offer a wide range of services that help researchers and firms achieve high level of understanding from their data in order to make better decision and perfect plans Consultancy Support Consultancy Support You may have understood statistical concept but you don't fully understand how to carry out the analysis needed to turn data into information you can trust, we will guide you to the appropriate analysis technique or statistical test and the best way to present the result. Data Management and Administration Data Management and Administration We help you cross-link your various data source pulling data together to understand, measure and predict how your organization operates so you can spot opportunities for increasing sales, efficiency and performance. Surveys and market research Surveys and market research The essential tool for collecting information on opinions, behavior, performance and demographics is Surveys, which they used to understand the needs of customers and employees in order to help business adapt to changing demands. Data Analysis and Mining Consultancy support You may have understood statistical concept but you don/t fully understand how to carry out the analysis needed to turn data into information you can trust, we will guide you to the appropriate analysis technique or statistical test and the best way to present the result. Data Analysis and Mining Statistical analysis ranges from simple summarization and exploratory analysis to complex modeling and hypothesis testing. They give you detailed insight into your data to create intelligent decisions. Visualization and dashboards Data Management and Administration We help you cross-link your various data source pulling data together to understand, measure and predict how your organization operates so you can spot opportunities for increasing sales, efficiency and performance. Visualization and dashboards A pleasing visualization is an important step in analysis to ensure that your results are easy to understand and suit your audience we help you select the suitable and ideal visualization tool to present your result. Meet Our Team Our team We are highly educated and uniquely experienced professional statisticians on various data types and with a profound knowledge in statistical analysis Mergahni Founder Merghani, CEO Master student at AMMI (African Master in Machine Intelligence) , teaching assistant, department of statistics UofK. Work experience: Data analyst and marketing intelligence at Sudani. BI specialist at NCTR. TA at UofK. Area of interest: Machine learning and AI. Sahar Founder Sahar, VP Experience: Part time TA department of computer science Uofk Statistician : ( - Institute of endemic disease UofK -Statistical consultancy Uofk -IA) Fields of interest Bio statistics - Bio-informatics - Statistical genetics Mohamed Senior Analyst Mohamed,S-A Education: BSc, MSc in Statistics, FMS, UofK Work experience: CVD&Churn Specialist at Sudani. Fields of interest: Business Analytics, Data visualization . Eman Senior Analyst Eman, S-A Master's degree holder in Statistics -UofK Experience:- Statistical consultancy -IA بFields of interest: business analytics- Bio-statistics Sana Consultant Sanaa,Consultant Lecturer, department of statistics UofK Statistician ( the statistical consulting unit UofK- IA) Field of interest: bio-statistics and epidemiology Musa Junior Analyst Musa Bachelor student Satatistics and cs at UofK Experience:- Statistical Fields of interest: machine Learning - Sentiment analysis M.Hassan Senior Analyst M.Hassan, S-A Work experience: Market-Research analysis at Sudani. Part time TA at statistics department, UofK. Data analyst at SCU. Fields of interest: Business&Research Analytics, Biostatistics&Medical informatics, Financial data science. Ehsan Junior Analyst Ehsan Bachelor student Information technology at UofK Experience:- HR

DJ download presentation!!

Transcript: START! A DJ or "Disc Jockey" is aperson who plays recorded music and mixes two or more tracks or records. In 1857, a Frenchman, Leon Scott Invented the first phonoautograph. This device was used to record sound but with no way to playback. It was made of a wax cylinder with grooves on the outside. Soon Emile Berliner's Gramophone would replace it in 1887. The Gramophone also has grooves on it for recording only it's a plastic disc making it re-usable. Some time in Jamaica during the 50's some premotors who called themselves "Djs" would play two different songs on seperate Gramophones with a mix-board in the middle(third pic below). DJs and songs! Biblyographies: http://en.wikipedia.org/wiki/Disc_jockey http://www.rane.com/note146.html A Website address: http://howtodj.djdownload.com/ Modern day portable Mix-board (DDJ-ERGO) Effects units Vinyl records Two record players or an mp3 Multiple Sequencer Sound system DJ mixer Headphones microphone(optional) Effects units(eletronic altering device) FINISH! ? 5 Skrillex ( Sonny Moore) Born in, January 15, 1988 Los Angeles, California, USA Present Felix Da HouseCat ( Felix Stallings Jr) Born on August 25, 1971, Chicago, Illinois,USA Present 1 Vinyl records 3 Phonoautograph Nujabes (Jun Seba) Born in Japan, February 7, 1974 Died at the age of 36 on February 26, 2010 History of the DJ! 2 microphone 4 DJ with traditional Mix-board. 4 DJ download.com is a website where famous DJs give tips and tricks on how to DJ. Gramophone David Guetta Born on November 7th 1967 in France Present DJ mixer A presentation on Djs,their history,their tools, and some tutorials! 5 Headphones TOOLS of aDJ! 3 Multiple Sequencer Excision (Jeff Abel) Born in Kelowna, British Columbia, Canada 1986 Present 1 Record player 2 Sound system

IEEE presentation

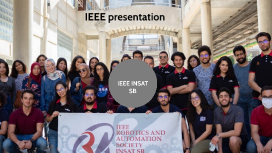
Transcript: IEEE presentation IEEE INSAT SB Introduction I'm Maryem Manai, a second-year Automation and Industrial IT student at INSAT,and I'm applying for the human resource manger of IEEE INSAT SB 2021/2022 My Experiences experiences *I participated as a stuff in:hour of code(CS)/DevX(CS)/national robotic weekend: stuff forum et workshop(RAS)/she-solves(WIE) *I was among the participants of Summer School/Xtreeme/Arduino sessions/workshop IOT/compétition internal RAS X Aerobotix *As long as I worked with INSAT ACM as project manager of ACM career, program manager of winter cup. * Now I am the sponsoring manager of Robolympix and I work as staff with Aeroday my goals are: *working more on the Junior side *make members feel at home and keep in contact with them by regular meeting to encourage him and why not to make an application that inform each one about our new event, workshops; we can also give scores to members to make things interactives * I will work on encouraging members about the pratic side(projects) and talk about her importance, we can organize compétitions and collaborate with other clubs. *collaborations between our different chapters in order to teach members and to talk about the link between them *condenses the soft skills formation(management, how to create a cv...) *openness to new domains like aeronautique, entrepreneurship... vision *due to my various experiences I discovered that I'm a very sociable person *also I have a high motivation that I can pass to the new members *if I would be the RH manager I would talk about my experience and how in just one-year of membership in IEEE I managed to become the RH manager despite the health obstacles(corona) *My admiration for IEEE gives me the ability to persuade new members of the importance of integration in the future and the opportunities that gives IEEE. why me memories thank you for your attention and I hope that my profile interests you! thank you

Now you can make any subject more engaging and memorable