Presentation DASHBOARD
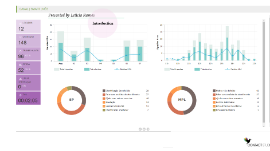
Transcript: Presented by Leticia Ramos Introduction Objective This dashboard was made to show results of an IVR (Interactive voice response) operation on an Call Center Data science is an interdisciplinary field that uses scientific methods, processes, algorithms and systems to extract knowledge and insights from data in various forms, both structured and unstructured. Data science is a "concept to unify statistics, data analysis, machine learning and their related methods" in order to "understand and analyze actual phenomena" with data. It employs techniques and theories drawn from many fields within the context of mathematics, statistics, information science, and computer science. Database A database is an organized collection of data, stored and accessed electronically. Database designers typically organize the data to model aspects of reality in a way that supports processes requiring information. A database-management system (DBMS) is a computer-software application that interacts with end-users, other applications, and the database itself to capture and analyze data. (Sometimes a DBMS is loosely referred to as a "database".) A general-purpose DBMS allows the definition, creation, querying, update, and administration of databases. A database is generally stored in a DBMS-specific format which is not portable, but different DBMSs can share data by using standards such as SQL and ODBC or JDBC. Dashboard A dashboard is an information management tool that visually tracks, analyzes and displays key performance indicators (KPI), metrics and key data points to monitor the health of a business, department or specific process. They are customizable to meet the specific needs of a department and company. Behind the scenes, a dashboard connects to your files, attachments, services and API’s, but on the surface displays all this data in the form of tables, line charts, bar charts and gauges. A data dashboard is the most efficient way to track multiple data sources because it provides a central location for businesses to monitor and analyze performance. Real-time monitoring reduces the hours of analyzing and long line of communication that previously challenged businesses. Programming language A programming language is a set of commands, instructions, and other syntax use to create a software program. Languages that programmers use to write code are called "high-level languages." This code can be compiled into a "low-level language," which is recognized directly by the computer hardware. Data scientist A person employed to analyze and interpret complex digital data, such as the usage statistics of a website, especially in order to assist a business in its decision-making. Python is an interpreted high-level programming language for general-purpose programming. Created by Guido van Rossum and first released in 1991, Python has a design philosophy that emphasizes code readability, notably using significant whitespace. We start with a date treatment, the process of this treatment clear all the accumulated data every first day of the month, that’s because the dashboard was made to show monthly results of an IVR (Interactive voice response) operation. Keywords in Python programming language We cannot use a keyword as variable name, function name or any other identifier. They are used to define the syntax and structure of the Python language. In Python, keywords are case sensitive. There are 33 keywords in Python 3.3. This number can vary slightly in course of time. All the keywords except True, False and None are in lowercase and they must be written as it is. After that we create a function that we can identify on the code beginning with the reserved word def, this function treat a specifically field on our available data that came in seconds, as we can see we use “format” to return this seconds in a structure that is more pleasing to the human eyes and easier to understand without mathematical calculations. We also created a def to remove outliers, means the values that take of the values that is out of the line, like too big and little values. The next def returns the quantity of head count, the number of agents that are logged on the platform To measure and sum all the data available, we perform a query to the CASSANDRA database, also within a function. We define dictionaries where we will store the totals returned from the query and call the function created data_date, storing it in a single variable we start to scan the result of this variable with a loop "FOR"and store the contents separately in new variables we add the totals returned in each dictionary previously defined with the "setdefault" method In this part of the code we access the totals of each setdefault and separate them to fill in all the boxes We do the same with the data from the screw chart And finally, in the variable "data", we leave everything in a dictionary accessible for the front end to work with the data at the time of creating the dashboard A bit of


