You're about to create your best presentation ever

Business Analytics Powerpoint Template

Create your presentation by reusing a template from our community or transition your PowerPoint deck into a visually compelling Prezi presentation.

Business Analytics

Transcript: By: Michael Turriff Business Analyst Career Choice http://www.iiba.org/Careers/What-is-Business-Analysis.aspx Tasks Investigating goals and issues Analyzing information Communicating with a broad range of people Evaluating solutions Putting the responsibility in effect Daily Responsibilities Normally done in office environment Some computer based Project based meaning deadline is very long May speak with client often May need to travel far Working Conditions Conditions Analytical- abilitiy to find solution Technical- Being able to program and model based off statistics Knowledge- To understand the business and understand math Person- Ability to communicate with people Skills Needed Talent Diploma High School Education EDU College Education Bachelor's Degree Master's Degree National Median- $65,973 National Range- $50,000-93,000 Green Bay Median- $47,380 Green Bay Range- $42,000-70,000 Salary $ Unniversity of Pennsylvania New York University University of Michigan-Ann Harbor Ann Arbor Michigan Bachelor's, Master's, and Doctoral Out-of-State Undergraduate $43,476 Out-of-State Graduate $41,688 https://www.umich.edu/ Top College Top College Websites Sources https://www.batimes.com/articles/a-day-in-the-life-of-a-business-analyst.html https://myjobsearch.com/careers/business-analyst.html https://www.glassdoor.com/Career/Overview/Business-Analyst.htm http://study.com/articles/Business_Analyst_Educational_Requirements.html https://learn.org/articles/What_Education_is_Required_to_be_a_Business_Analyst.html http://study.com/articles/Schools_with_Business_Analyst_Programs_How_to_Choose.html http://www.businessanalystbootcamp.com/wp-content/uploads/2012/09/what_why_where_when_how.jpg https://resources.workable.com/wp-content/uploads/2015/08/business-analyst-640x230.jpg https://www.mba-healthcare-management.com/wp-content/uploads/2015/10/university-of-michigan-ann-arbor-bachelor-of-science-in-informatics.jpg http://qabatraining.com/wp-content/uploads/2017/10/business-analyst-01.jpg http://pmstories.com/en/wp-content/uploads/2008/09/Business_Analysis02-818x400.jpg

Business Analytics

Transcript: - Three to Four years minimum 1. Follow through with your promises and explanations 2. Detail orientation 3. Critical thinking skills 4. Resourcefulness Ability to go into a wide field of workplaces Because of their business experience, they can fill in for tons of jobs EX: Business consultant, Marketing Manager, Marketing Director “Role of Consultant.” Role of Consultant | The Denver Foundation Inclusiveness Project, www.nonprofitinclusiveness.org/role-consultant. - Most of the time, self employed What is a Consultant? Sources “Consultant Job Description - How to Become a Consultant.” Snagajob, www.snagajob.com/job-descriptions/consultant/. How do I become a Consultant? Education and Training Aptitudes and Values Muse, T. (2017, February 27). Be The Best Consultant Ever: 6 Things That Will Make You Great. Retrieved October 31, 2017, from https://www.forbes.com/sites/dailymuse/2013/11/05/be-the-best-consultant-ever-6-things-that-will-make-you-great/2/#775f616e50ee How can a consultant further the Kingdom of God? - A consultant is an adviser who provides their expert advice in a variety of different fields (Bridal, leasing, media, etc.) - help businesses attain goals and solve problems within their business - Responsible for collecting and analyzing data to benefit the company they are working for. Salaries and Benefits Zach Anderson Michael Fritchman Taylor Weiss Business consultants receive full benefits if they work for larger companies. often business consultants own their own practice meaning they don't have the benefits working for other companies - Strong analytical, research skills - Communication and presentation skills - Not hard to find a job straight out of college - Self-employed What makes a good consultant? (Advertising, Product Placement) How long will it take to become a Consultant? - Most of the time, earn a degree in Business Administration, Marketing, any related degree Average Salary: $72,000 Starting Salary: $46,206 Integration https://www.payscale.com/research/US/Job=Business_Consultant/Salary - Knowledge of digital marketing/performance Business Analytics: The Consultant A business consultant can help the Kingdom of God by helping His church. "My son, preserve sound judgment and discernment, do not let them out of your sight...Do not withhold good from those whose deserve it, when it is in your power to act." Proverbs 3:21, 27 "If any of you lacks wisdom, he should ask God, who gives generously to all without finding fault, and it will be given to him. James 1:5 - Internships Advancement Opportunities

Business Analytics

Transcript: IBM Business Analytics in Insurance Role of Analytics in The Travelers Analytics Defined Introduction Emerging Trend in Business Analytics Evolving with Analytics - IBM Coffee + Conversation Descriptive Analysis: It is the analysis we get from our web server and it helps in quickly understanding what has happened in the past. Diagnostics Analysis: To go deeper into the data and understand why it has happened business intelligence tools can be used to get the insights. Predictive Analysis: Collecting data and correlating it with other user behavior datasets a whole new area is created to get real insights which helps in predicting about "What is likely to Happen?". Prescriptive Analysis: Once the future is predicted as what is going to happen it becomes easy to analyze what should be done in order to maximize good outcomes and also prevent potentially bad outcomes. Analytics in the World of Decision Making Before Analytics: Insurance companies like Travelers have TBs of data stored in warehouses since years. To them, data was useless and made no sense until the field of Business Analytics strongly came into the enterprise world. Thank You In the late 2000's business analytics was introduced to represent the key analytical component in BI. Based on a survey of over 4,000 information technology(IT) professionals from 93 countries and 25 industries, the IBM Tech Trends Report(2011) identified business analytics as one of four major technology trends in the 2010s. ("A 2012 publication on Business Intelligence and Analytics authored by, Hsinchun Chen, Roger H. L. Chiang & Veda C. Storey ; Decmber,2012") Analytics is an emerging field of modern data analysis used to help companies and people drive important decisions. Analytics revolves around the data that exist on a daily basis. Business analytics comprises of solutions used to build analysis models and simulations to create fact based management to drive decision-making. Advantages: Background: As per many companies, there are huge opportunities in the field of Analytics but, they have a fairly limited budget and resource pool to deploy. Another challenge faced by many companies is with historic IT infrastructure which isn't optimal for big data analytics, so some of the data extraction processes are fairly clunky. Apart from this the triple challenge that companies face: deciding which data to use (and where outside your organization to look), handling analytics (and securing the right capabilities to do so), and using the insights you've gained to transform your operations. Misconceptions around these tasks trip up many companies The gap between relevant analytics and user's strategic business needs is characterized by several challenges: 1. Cycle time 2. Analytic time and expertise 3. Business goals and metrics 4. Goals for data collections and transformations 5. Distributing analysis results 6. Integrating data from multiple sources ("A 2002 publication of the emerging trends in business analytics, authored by Ron Kohavi, Neal J. Rothleder, Evangelos Simoudis; August 2002") Market Share & Statistics Big Data Analytics Market size by Business Category http://hmchen.shidler.hawaii.edu/Chen_big_data_MISQ_2012.pdf http://dl.acm.org/citation.cfm?id=545177 http://en.wikipedia.org/wiki/Business_analytics http://www.forbes.com/sites/louiscolumbus/2014/06/24/roundup-of-analytics-big-data-business-intelligence-forecasts-and-market-estimates-2014/ http://www.statista.com/statistics/267785/global-market-share-held-by-business-analytics-software-vendors/ http://www.pewinternet.org/2012/07/20/the-future-of-big-data/ http://www.gartner.com/it-glossary/business-analytics http://www.snia.org/sites/default/files2/ABDS2012/Tutorials/RobPeglar_Introduction_Analytics%20_Big%20Data_Hadoop.pdf http://searchbusinessanalytics.techtarget.com/definition/business-analytics-BA www.youtube.com Lessons Learned Insurance Industry: The Travelers Travelers provides insurance for individuals and for business: Types of Analytics At travelers, the department of Analytics is widely active and contributes a lot towards the decision making process in almost every major department like New Insurance Purchase or Claims etc. By running data onto Analytical tools, they get an idea of the factors that contribute towards the nature of a new purchase or any claim made.. The factors effecting the business decision are very well identified and worked upon at this company. The Travelers Company is an American Insurance Company based in NewYork Incorporated as St. Paul Fire & Marine in 1853, merger of the St. Paul Companies and Travelers Property Casualty Corp. in 2004. Second largest writer of US commercial property casualty insurance. Third largest writer of US personal insurance. It has more than 30,000 employees and operations in the United States and selected International markets. It generated revenues of $26 billion in 2013. Facilitates the cost benefit analysis Gives a more accurate value of the

Business Analytics

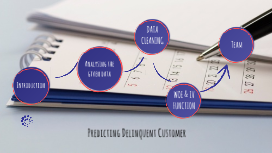
Transcript: Predicting Delinquent Customer Credx company data Credit card provider having approx 70k customers. Demographic data: Includes customer level information on age, gender, income etc. Credit Bureau data: Includes the variables such as 'no of times 30DPD or worse in last 3/6/12 months', outstanding balance, number of trades etc. Introduction Performance tag PERFORMANCE TAG Both the files contain a performance tag which states that whether the customer is defaulted or not. If the customer is paying loan on time or the customer has gone 90 days past due or worse in the past 12 months after getting a credit card. Analysing the given data Analysing the given data 1. According to the given data, We can say that age group of most of the CredX customers are between 35 to 55. 2. Number of males customers in the CredX company are thrice than the number of Female customers. 3. There are 71295 customers, out of which approx 61000 are married. 4. Most of the customers have 3 dependents whereas few customers have only 4 to 5 dependents. REsults DATA CLEANING There are 1425 customers who are not paying the credit card loan back on time that means almost 5% customers are defaulters. First, We checked the duplicates in the data by using group_by function. There are 3 duplicates in both of the data i.e. Credit Bureau and Demographic data. Checking Duplicates We checked the class of all the variables, if categorical independent variables are factors, if dependent categorical variable is integer (not factor), both of these are done to use the woe and IV functions effectively Class of all variables checking for NA in Performance.Tag i.e dependent categorical variable, missing values in dependent variable cannot be practically solved, thus we resort to removing them from the dataset. CHECKING FOR NA IN PERFORMANCE TAG WOE FUNCTION WOE & IV FUNCTION It can handle the missing values by creating separate bins for missing values. Easy to remove outliers. It can handle the categorical data. There are a number of unavailable entries (NA) and outlier values within the data, We will replace these values with the respective WOE values, indicating a relationship with the respective target value. For this, we make use of the scorecard package. WOE ANALYSIS We have plotted woebin of Average Credit Card Utilization in last 12 months, there are 4 bins in the graph. we can see that woe_bin created one extra bin for missing values that means 1.5% values are missing from this data. Almost 50.9% customers used their CC from 1 to 16 times in a year where as only 9.3% customers used their card more than 16 and below 24 times. We can see that 72.3% of customers delayed their payment 1 times whereas only 11% of customers delayed their payment in 90 days more than 2 times. EXAMPLE 2 IV STATISTICS iv statistics It helps to rank variables on the basis of their importance. CREDX IV ANALYSIS Vinayak Balachandra Menon kamaldeep kaur Xinkai Zhou Team

Business Analytics

Transcript: Data set #3 Compute the Sample “variance”. Add results and divide by 1 less the sample size 6153336.67 434291.5441 3491262.354 13363396.74 1188.732484 23443476.04 / (5-1) = 5860869.01 This is your sample variance. Question- In 2012 how much money per employee did enterprise spend in hiring? *Root cause analysis 5 whys Why Does enterprise spend money hiring people? Why does enterprise want to hire the best candidate? Why does enterprise care about retention? Why is management recognized for retention efforts? *Employees possess business knowledge (both internal and external)- that can benefit the company as a whole. An example of this is our “we’ll pick you up” slogan. Supporting decision(s) HR Spending decisions, forecasting decisions Deployment Who was most calibrated? Formatting Recruiting Cost Ratio The only difficult part of data preparation was formatting the data in a way that I could easily identify the costs involved. Part of my data required alteration so as to properly analyze it. Data Analysis Apply for this job: Job ID: 2012-73826 Location: US-MO- Area: St. Louis * Apply for this job online We are an Equal Opportunity Employer M/F/D/V. More information about this job: Overview: Enterprise Holdings has an exciting opportunity for a Business Analyst on the Corporate Airport Team! The Airport Business Analyst is responsible for solving business problems through data research and system/tool development. This position will analyze needs, create and deliver new rental reports for both our Group and Corporate Airport operations. Under general supervision, this position will gather, interpret and document reporting requirements/requests and develop moderately complex to complex queries/SQL statements to produce report results. The Airport Business Analyst will serve as the subject matter expert for their area of focus, providing the groups insight in key business metrics to identify areas of continued opportunity. This position is based at our Corporate Headquarters in St. Louis, Missouri. Questions? Detailed transactions 101.61- CPH went to the employee referral program 72.64- CPH went to the ADP Screening 32.33-CPH went to Commerce bank- (flight expenses) *Okay now what is the cost per FT employee? Per PT employee? The T-Statistic The T-Statistic Thinking back to my secondary research regarding the recruiting cost ratio (RCR). I remembered them dividing cost up into four categories Internal External Travel Signing Bonus I would like to add one more “Unknown” With these cost types, I couldn’t help but think about another chart detailing the expense per hire in regards to cost type….. Upper bound winner? Lower bound winner? Combined data set How I calculated FT and PT CPH Business understanding Business understanding Business understanding Did our results answer our question? It did more Not only was I able to calculate the cost per new hire- I did the cost per FT new hire and PT new hire. I discovered a new metric to rate recruiting cost. (RCR) Using the T- Statistic I calculated a 90% CI for next month’s recruiting expense Data preparation How do other companies handle this? Humanresourcemetrics.org Shared a metrics called the recruiting cost ratio (RCR) This is metrics was new to me and peeks my interest The formula is simple enough. Does Enterprise have analysts? Programs used to analyze my data set Excel SAS I started with excel and created a pivot table With the pivot table I graphed a bar chart to highlight the areas where we are spending the most money per new hire. (full time, part time, total) Data set #1 Business understanding The T-Statistic Data preparation (snap shot) Created these calculated columns- Business understanding Identify the opportunity Data Understanding Where did the data come from Data preparation Quality of data Data Analysis What methods did we use Evaluation Deployment Compute the Sample “variance”. Subtract average from each sample. 6865.54 - 4384.948 = 2480.592 3725.94 - 4384.948 = -659.008 6253.44 - 4384.948 = 1868.492 729.35 - 4384.948 = -3655.598 4350.47 - 4384.948 = -34.478 Square the results From this Pie Chart you can see that for every PT new hire, the company will spend on average, $72.64 in Screening, $40.68 in employee referral bonuses. Some differences in this chart is It differently so that it would include the percentages of the pie with the data. Formulate Confidence Interval Add Sample Error to mean to get UB 4384.948 + 2306.866 = 6691.814 Subtract sample error to mean to get LB 4384.948 - 2306.866 = 2078.082 CI statement- I am 90% confident that next month’s recruiting expense will be between $2078 and $6691 Final Project The T-Statistic The T-Statistic Business understanding The End SaS Compute the Sample “variance”. Square the results 2480.592 ^2 = 6153336.67 -659.008 ^2 = 434291.5441 1868.492 ^2 = 3491262.354 -3655.598 ^2 = 13363396.74 -34.478 ^2 = 1188.732484 Add results and divide by 1 less the sample size Data set #4 In order to produce this chart

Now you can make any subject more engaging and memorable