You're about to create your best presentation ever

Annual Sales Presentation Template

Create your presentation by reusing one of our great community templates.

Sales Presentation Template

Transcript: Identifying Target Market Identify the specific demographics, behaviors, and preferences of your target market. Utilize tools such as surveys, market research, and customer segmentation to gain insights into potential customers and refine your approach accordingly. Introduction to Sales Presentations Importance of Sales Presentations Sales presentations are critical tools for conveying value, engaging potential clients, and closing deals. They provide a structured platform for sales professionals to communicate effectively and influence decision-making. Sales presentations play a crucial role in converting prospects into customers. They enable sales professionals to showcase products or services clearly, address client pain points, and differentiate from competitors. A well-crafted presentation can significantly increase the chances of closing a sale. Analyzing Audience Needs Understanding Your Audience Analyze your audience by gathering data on their pain points, desires, and purchasing habits. Conduct interviews, online polls, and review feedback to identify what resonates with them to strengthen your sales message. Understanding your audience is crucial for tailoring sales presentations effectively. Identifying who they are enables you to address their needs and preferences, ensuring impactful engagement during your pitch. Key Elements to Include Objectives of Effective Sales Presentations Tailoring Your Message Key elements of a successful sales presentation comprise an engaging introduction, a clear value proposition, relevant data or testimonials, and a compelling call to action. Each component strengthens the overall message and enhances the likelihood of securing a sale. The main objectives of effective sales presentations include informing, persuading, and motivating the audience. By clearly presenting value propositions and addressing objections, sales reps can foster trust and encourage action from prospective buyers. Customize your presentation to align with the audience's needs and preferences. Use language, examples, and solutions relevant to them, ensuring your sales pitch feels personalized and well-targeted, maximizing engagement potential. Sales Presentation Template Utilizing Storytelling Techniques Including Case Studies and Testimonials Crafting a Strong Closing Highlighting Benefits Over Features Incorporating storytelling into presentations makes information relatable and memorable. Utilize real case studies that resonate with the audience, creating emotional connections and reinforcing your message throughout the presentation. Shifting focus from features to benefits emphasizes how your offering enhances customer experiences. Effective presentations highlight how solutions positively impact the user's life or business rather than simply listing specifications, fostering deeper connections. A strong closing reinforces your main message and compels action. Summarize key points succinctly and provide a clear call to action, guiding potential customers on the next steps to take after the presentation. Case studies and testimonials provide social proof of your product’s effectiveness. Sharing real-world instances where your solution produced tangible results enhances credibility and demonstrates value through relatable experiences. Managing Q&A Sessions A Comprehensive Guide to Crafting Effective Sales Presentations Presenting Your Value Proposition Q&A sessions are crucial for audience engagement. Prepare for potential questions beforehand and encourage open dialogue. Address queries respectfully while steering the conversation back to your key messages. Clearly articulating your value proposition distinguishes your offering from competitors. This statement should succinctly explain how your product or service solves a problem, provides value, or meets specific needs, making it memorable and compelling. Practicing Effective Delivery Designing Engaging Visual Aids Strong delivery skills involve more than just speaking effectively. Practice body language, vocal variety, and pacing to convey confidence. Engaging with the audience through eye contact reinforces connection and interest. Visual aids should complement the presentation, not overwhelm it. Use high-quality images, relevant graphs, and concise text to support key points. Consistent branding and color schemes enhance professionalism and improve viewer retention. Structuring the Presentation Gathering Feedback for Improvement Effective presentation structure is critical for engaging your audience and conveying your message clearly. By thoughtfully organizing content, presenters can maximize impact and retention, guiding prospects toward a favorable decision. Post-presentation feedback is vital for growth. Use surveys or informal discussions to gather insights on audience perceptions and areas for improvement. Analyzing feedback allows for better presentations in the future. Crafting a Compelling Opening Visuals and Delivery

Annual Sales Presentation

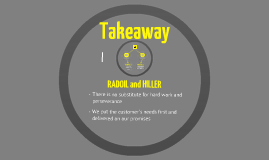
Transcript: They informed us that the quoted price was too high Opportunity Takeaway They were treated well and made to feel like they were an important new customer They are a high dollar offshore oil customer Shaun Gray initiated contact with Hiller and negotiated well enough to convince them to visit WC Action Dave Schweiger gave them a great tour of the facility, and they were "WOW'd" by the near net shaped product line Hiller was looking for new suppliers for their decanter-style centrifuges There is potential for orders in the near future Convincing them to tour and then rolled out the red carpet for them RADOIL Above and Beyond The specifications and units were interpreted and converted into the proper format We put the customer's needs first and delivered on our promises There is no substitute for hard work and perseverance RADOIL and HILLER They are a $500,000 annually potential customer Radoil was impressed with the proposed price and quality of the parts in question Worked with Radoil to help make sure the wrought specifications were satisfied with the as-cast tubes that were ordered Action We provided them with a quote for a rough machined part Situation Technical support was supplied by Sandusky engineers and samples were sent to Radoil Hiller is a dynamic and expanding German company Result HILLER PLUS 1 All of their specifications were in German and all of their units required conversion Radoil's customer is National Oilwell Varco They make a many different types of centrifuges Result The parts shipped and performed well so far Radoil specializes in depth compensated accumulators HILLER Hiller placed an order for five trial parts from WC to be put into varied centrifuge applications At the end of the meeting, they placed a 1.2 million dollar order for the as-cast version of the tubes RADOIL PLUS 1 Samples were sent to Radoil for review with their engineers Opportunity Addressed Challenges and Conquered Radoil wanted to utilize the cast alternative to wrought pipe There is a potential for improved relations Jason Kay remained in contact with the customer and proposed that they look at as-cast tubes instead Situation

Annual sales

Transcript: SALES REPORT Your Company Name Summary Summary Sales YTD Analysis Pipeline Pipeline Sales by Region America Sales by Region Europe Asia Sales Rep Name Sales Leaderboard Sales Leaderboard Sales YTD Lead Report Lead Report GAP Exports GAP Business Analysis - 2015 to 2016 Yearly Gap Business 2015 2016 Percentage Change 1,860,287 2,524,160 é 36% Division Q1 '15 Q1 '16 Percentage Change GAP BR 132,050 51,776 GAP Adults 143,377 290,795 GAP KB 10,903 88,198 GAP Outlet 52,493 29,466 GAP ON 435,650 154,477 Total Gap Business 774,473 614,712 ê -21% Average Price $3.56 $2.96 Division Q2 '15 Q2 '16 Percentage Change GAP BR 54,375 8,000 GAP Adults 90,627 135,618 GAP KB 2,200 290,848 GAP Outlet 0 28,619 GAP ON 140,599 276,626 Total Gap Business 287,801 739,711 é 157% Average Price $3.86 $3.04 Division Q3 '15 Q3 '16 Percentage Change GAP BR 29,320 0 GAP Adults 179,903 37,965 GAP KB 2,290 149,411 GAP Outlet 8,499 0 GAP ON 57,500 505,075 Total Gap Business 277,512 692,451 é 150% Average Price $3.63 $2.96 Division Q4 '15 Q4 '16 Percentage Change GAP BR 28,128 0 GAP Adults 288,114 17,064 GAP KB 44,160 165,361 GAP Outlet 0 28,289 GAP ON 160,099 266,572 Total Gap Business 520,501 477,286 ê -8% Average Price $3.02 $2.79 Lead Volume Lead Sources Lead Sources Wins & Losses Wins & Losses Wins Wins Losses Losses Sales by Region GAP Exports GAP Business Analysis - 2015 to 2016 Yearly Gap Business 2015 2016 Percentage Change 1,860,287 2,524,160 é 36% Division Q1 '15 Q1 '16 Percentage Change GAP BR 132,050 51,776 GAP Adults 143,377 290,795 GAP KB 10,903 88,198 GAP Outlet 52,493 29,466 GAP ON 435,650 154,477 Total Gap Business 774,473 614,712 ê -21% Average Price $3.56 $2.96 Division Q2 '15 Q2 '16 Percentage Change GAP BR 54,375 8,000 GAP Adults 90,627 135,618 GAP KB 2,200 290,848 GAP Outlet 0 28,619 GAP ON 140,599 276,626 Total Gap Business 287,801 739,711 é 157% Average Price $3.86 $3.04 Division Q3 '15 Q3 '16 Percentage Change GAP BR 29,320 0 GAP Adults 179,903 37,965 GAP KB 2,290 149,411 GAP Outlet 8,499 0 GAP ON 57,500 505,075 Total Gap Business 277,512 692,451 é 150% Average Price $3.63 $2.96 Division Q4 '15 Q4 '16 Percentage Change GAP BR 28,128 0 GAP Adults 288,114 17,064 GAP KB 44,160 165,361 GAP Outlet 0 28,289 GAP ON 160,099 266,572 Total Gap Business 520,501 477,286 ê -8% Average Price $3.02 $2.79 Sales by Region

Sales Template

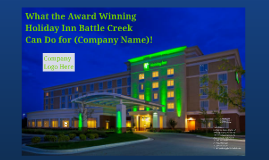
Transcript: What the Award Winning Holiday Inn Battle Creek Can Do for (Company Name)! Conveniently located moments away from I-94 for easy access to all Battle Creek has to offer. Complimentary WiFi throughout the entire hotel. Business Center on the main floor. Guest Self-Laundry on 3rd floor Off-Site Dry Cleaning available Mon.-Fri. On-Site Fitness Center Passes available to Feeling Fit Fitness In-door Heated Pool set to 84 degrees Teri Pearce Corporate Sales Manager Holiday Inn Battle Creek 12812 Harper Village Dr. Battle Creek, MI 49014 D: 269-589-9530 P: 269-979-0500 F: 269-979-0501 E: teri.pearce@focushotels.com Company Logo Here Walmart Meijer Kohl's Menards Executive Boardroom Free WiFi Iron with Ironing Board Coffee Maker Complimentary Parking Around Entire Building Perfect blend of Old-World traditional hospitality and contemporary design with modern amenities. With more than 5,000 sq. ft. of meeting space. Full-Service restaurant, Cereal City Grill, located off lobby. Open for breakfast and dinner daily. Restaurant, Lounge, and Patio Types of Events: *Trainings *Receptions/Dinners *Seasonal/Annual Parties *General Meetings *Conferences *Ceremonies *Auctions *Tournaments *Fundraiser Events Etcetera Best Buy Rue 21 Macy's JC Penney's Harvest Ballroom IHG Rewards Club *Absolutely Free *Points Never Expire *Earn on Room Rate and Restaurant Charges *Redeem for Free Night Stays or Merchandise IHG Meeting Rewards Program *Attach IHG Rewards Number to Participate *3 Points/Dollar on Room Rental *2 Points/Dollar on Catering Charges Located minutes away from more than 50 retail outlets. 120 beautifully appointed guest rooms, including; family suites and executive suites

Annual Sales Presentation

Transcript: Competitive Landscape The semiconductor industry faces intense competition with key players innovating rapidly to capture market share. Companies are investing significantly in R&D to develop cutting-edge technologies, ensuring they remain relevant and competitive in a fast-evolving market. Annual Sales Presentation Technology Advancements Comparative Analysis of Semiconductor Foundries for FY2024 and FY2025 Technological evolution is a major factor shaping semiconductor sales, with trends like 5G, AI, and machine learning driving the need for more sophisticated chips. Investment in new manufacturing processes and materials is crucial to meet the demands of these emerging technologies. Market Demand Analysis Factors Influencing Sales The semiconductor market is driven by exponential growth in sectors such as automotive, consumer electronics, and IoT. According to industry reports, the global semiconductor market is projected to grow by over 8% annually, reflecting rising demand for advanced chips in various applications. Understanding the dynamics that influence sales in the semiconductor industry is critical for accurate forecasting and strategic planning. This section analyzes market demand, competitive landscape, and technological advancements that shape the sales environment. Revenue Growth Trends Revenue in FY2023 totaled $200 million, with FY2024 projected revenue rising to $250 million. This 25% growth reflects strategic investments and improved operational efficiency within semiconductor foundries. Purpose of the Presentation Summary of Key Findings Introduction to Semiconductor Industry Conclusion and Call to Action This presentation aims to analyze and compare the sales performance of semiconductor foundries for FY2023 and FY2024, while also forecasting the FY2025 budget. It will provide actionable insights into device sales and revenue generation across key accounts. FY2024 forecasts show an increase in sales potential, with projected device sales anticipated to surpass FY2023 levels. Key accounts remained stable, contributing significantly to revenue, along with emerging demand in advanced semiconductor technologies. These insights indicate a strong growth trajectory ahead. The semiconductor industry is a crucial driver of technological innovation, accounting for a transformative role in various sectors including electronics, telecommunications, and automotive. Understanding the trends and forecasts in this industry sets the stage for analyzing sales performance and future opportunities. This section synthesizes the critical findings from our sales analysis, highlighting the trajectory from FY2023 to FY2024, and outlines strategic recommendations moving forward. Emphasis is placed on actionable insights to drive future success. FY2023 vs FY2024 Sales Comparison Comparative Analysis Overview of Semiconductor Industry In FY2023, total device sales reached 5 million units, while projections for FY2024 indicate a growth to 6 million units. This represents a significant increase of 20%, driven by heightened market demand and expansion in key accounts. This section provides an in-depth comparison of the sales performance and revenue trends between FY2023 and FY2024 for semiconductor foundries, highlighting key differences and insights. Strategic Recommendations To capitalize on growth, prioritize investments in high-demand areas and enhance relationships with key accounts. Additionally, focus on innovation in semiconductor technologies to meet evolving market needs and align budget allocations accordingly for FY2025. The semiconductor market was valued at approximately $600 billion in 2023 and is projected to grow to $1 trillion by 2030. This growth is fueled by increasing demand for consumer electronics, IoT devices, and advancements in AI technology. Budget Allocation by Account Total Number of Devices Sold In FY2023, semiconductor foundries sold approximately 120 million devices, reflecting a 15% increase year-over-year. This performance surpassed initial forecasts, highlighting strong demand across all major accounts. The budget for FY2025 is strategically allocated with 40% targeting key accounts known for their high volume and long-term contracts. Remaining funds focus on nurturing emerging accounts and investing in R&D to adapt to market changes and consumer demands. Revenue Generated The total revenue generated by semiconductor foundries in FY2023 reached $5 billion, marking a 20% growth compared to FY2022. This increase is attributed to higher device prices and expanded customer contracts across various sectors. FY2023 Sales Performance Anticipated Sales Goals Key Accounts Analysis For FY2025, we project sales goals to exceed FY2024 by at least 15%, driven by increased demand in sectors such as automotive and consumer electronics. This growth is supported by strategic partnerships and innovations in semiconductor technology, aiming for a robust bottom line. In FY2023, the semiconductor

WCT Sales Presentation Template

Transcript: Central Europe Vienna Salzburg April 27: Salzburg - Sound of Music Tour - Salzburg/Performance Cuenca Vienna, Austria Performance Tour to Austria Rouen April 24: Vienna Prague California Bath Derry Thank you for traveling with Salzburg Festspielhaus Figueres $2,799 P/P Dbl. Occ. (Plus Air Taxes Exceeding $450, Pending Air Confirmation) Check-in to hotel in Salzburg Temperatures range from 41*-60* F in April Home to one-fourth of the Austrian population Also home to the highest waterfall and the oldest carousel in the world Spain Argentina April 28: Arrive Boston 7:55pm Mont St. Michel St. Charles' Church Pienza Valencia Washington, D.C. France Cabo da Roca Haus der Musik Beijing Oxford Philadelphia Versailles Stratford-upon Avon Getreidegasse Connemara St. Petersburg April 23: Vienna/Performance Tallinn Hotel Europa Mondsee Riga Normandy April 22: Arrive Zurich 10:55am; depart Zurich 12:35pm Pompeii Portugal Coimbra Oporto Estoril Tandil Schönbrunn Palace/Performance April 25: Potential Performance, Recital at Melk Abbey Killarney Stockholm Savannah Capuchin Church San Gimignano Mar del Plata Dublin Dinner together at local restaurant Sorrento Sintra Florence Monserrat China Montreal Melk Abbey/Recital Charleston Klaipeda Caen Sitges Montalcino Italy Toledo Dinner together this evening United Kingdom Budapest Salzburg, Austria April 23: Potential Performance, Chapel of Schönbrunn Palace Montecatini Buenos Aires Quebec City Baltics Tarragona Belfast Shanghai April 27: Potential Performance, Salzburger Dom Mozart's Birth House Glendalough Barcelona Siena Yangtze River Hofburg Palace Tour Inclusions Vienna - 3* Free internet access Easy access to city highlights Amalfi Vilnius April 26: Salzburg/City Tour - Hallein Salt Mines - Salzburg April 21-28, 2014 Dover Roundtrip Airfare Six (6) Nights Accommodation Luxury Motor Coach Tour Manager Throughout Three (3) Performances Including One (1) Recital Breakfast Daily Welcome Dinner Two (2) Additional Dinners Farewell Dinner Sightseeing per Itinerary Standard A+ Travel Insurance Air Taxes Up To $450 Gratuities to Tour Manager, Driver & Local Guides Paris April 22: Arrive Vienna 1:55pm April 28: Depart Munich at 2:05pm April 25: Vienna - Melk/Recital - Salzburg Boston Naples Belmont High School Choir Star Inn Hotel Wien Schönbrunn Girona Lucca St. Peter's Abbey Temperatures range from 41*-59* F in April Salzburg is the birthplace of Wolfgang Amadeus Mozart, and is the fourth-largest city in Austria Madrid April 21: Depart Boston 9:45pm Rome Performance at Salzburger Dom Chongqing Sicily Have a safe and enjoyable journey! New York City Capri Canada Leopold's Castle Burren London Chicago Pisa Nanjing Chartres Farewell Dinner at local restaurant Salzburg - Superior 3* Walking distance to Mirabell Gardens Internet available Prater Park Canterbury Xi'an Helsinki Ireland Views of St. Gilgen on Lake Wolfgang Nonnberg Abbey Hallein Salt Mines Cascals Lisbon Welcome Dinner at hotel Stonehenge Galway

Sales Template

Transcript: Overall reach is longer-lasting vs. Finished Product By the end of the Discovery Phase, you will: Total cost: $100k Have a definitive budget for production DEFINE YOUR WHY It tackles the "why", so to speak, by showing what every athlete dreams of being...and they just happen to be wearing Under Armour. Advertising vs. Forced content Call to action is far less aggressive "That's me. I should do business with these guys?" Have a clear understanding of the style of the video Production DISCOVERY PHASE PRODUCTION PHASE It is a feeling. A brand is more than a name, logo, or look. We want them to relate to what they see. This is the most important part of creating a successful video. This is the part where we are extremely intentional in developing a plan that will drive results. Informs public about a product or service Under Armour "I Will" Campaign Communicates deals and special offers The Drive Media House Way! production phase We work through a two-phase process: VISION? Although this commercial shows a lot of Under Armour product, that's not what sells it. This commercial is successful because it connects with its target audience: athletes. Know what, when, and where we plan to shoot Throughout this phase, we work with you to ensure we are always on the same page. We'll get every piece approved before progressing. By the end of the video, the viewer will understand not just what you sell but what is at the heart of your company Brand development & awareness We want an inner part of them to say: Have a complete and approved script and storyboard How big is your Telling your story OUR PROPOSAL Leads customers to make a direct purchase Boot Country Work Country Marketing When planning CONTENT, we always This is where we make it all happen. Goal is to increase sales in a more direct manner Documentary START WITH WHY. Total cost: $20k -? scenarios/locations -? final videos Relating this to ?, we believe that the key to get your audience in the door is NOT by focusing all of our attention on the "what" (which is ?), but rather on the "why" (which is the lifestyle). Have a fully developed concept and plan for your production Customer engagement Evoke emotion DISCOVERY PHASE for your story as we said, the why is the lifestyle. Downy + Febreze: "The Extra Hour"

Now you can make any subject more engaging and memorable